




Methods & implementation status
Definitions before interpretation.
PRISM keeps acquisition references, metric settings and output provenance visible. This page describes the current research implementation and its practical limits.
Project origins
Project initiated in September 2021.
PRISM was initiated through the U.S. Forest Service Partnership for Remote Inventory and Stand Management (PRISM) project in September 2021.
01 / Execution
Local processing in a hosted application.
The web host delivers application assets. Public point-cloud nodes or byte ranges are downloaded from their providers, then decoded and processed on the user’s device with TypeScript workers and the LAZperf WebAssembly decoder. Local file analysis does not upload the selected point/raster file.
The site's host (Cloudflare) records anonymous visit statistics — the page opened, the referring site, browser and operating system, country and page-load timing — to help improve PRISM. No point data, study areas or results leave your browser.
The current queue uses one CPU worker. Temporary point spools use OPFS browser storage, with a bounded memory fallback for small jobs. Exact percentile work retains bounded height buffers; processing is not constant-memory or unlimited.
The five-minute performance panel samples supported JavaScript heap/limit and main-thread long-task blocking every two seconds. Ordinary pages cannot read system CPU %, GPU % or total RAM %. These are shown as unavailable rather than estimated from another signal.
The workspace is accessible across major operating systems using modern browsers. Large tiled jobs require desktop Chrome/Edge directory access and Web Locks. Results are session-local until exported; saved project settings do not include the raw point files or every analysis output.
The numbered suite reuses the current completed area analysis. For the prepared two-date demo, it calculates the seven supported exact-grid differences and runs tree workers sequentially on full CHMs. Prepared area statistics are labelled as reused; they are not represented as a new calculation on this device. Advanced raw-source reprocessing remains separate. Completed steps survive a later cancellation/error, and exports record available, skipped or failed outputs.
02 / Inputs
Sources, clipping and coordinate references.
Cloud readers support spatial EPT hierarchy retrieval and COPC HTTP Range access. All intersecting hierarchy levels are included. Candidate catalog rectangles identify possible acquisitions; they do not certify full AOI coverage. Points are decoded and clipped to the exact WGS84 study polygon, including its supported holes.
For a source chosen from the catalog, PRISM gives the collection window that the USGS project table (WESM, Workunit Extent Spatial Metadata) records for the source’s work unit, in the form “Collected between START and END (USGS record)”, or “Collected on DATE (USGS record)” where the record gives one day. The window is the collection period of the whole USGS work unit, not the flight date of the study area, and PRISM does not derive dates from the returns. The copy of the table that is used was retrieved on 2026-11-11 (UTC). Of the 2,282 catalog sources, 2,113 were joined to exactly one work unit by exact name rules and have a window; the other 169 have none, and a source opened by its own address has none either. Where no exact date is known, the provenance of a single run records the window, the work unit and the checksum of that copy of the table. The files of a tiled job do not record it, and the multiple-date workflow still needs dates that the user has verified.
Cloud processing excludes withheld returns and noise classes 7/18; overlap-flagged returns are retained. Source duplicates and acquisition effects need additional review. The point viewer receives a bounded sample independently of the full accepted metric input.
Cloud XY coordinates are transformed to an automatic WGS84 UTM grid. Source vertical length units must be reviewed; supported explicit length factors are converted to metres. No vertical datum transformation, automatic datum grid or inter-acquisition registration is applied. Review each original source reference rather than inferring Z units from horizontal CRS labels.
Local point import supports numeric CSV and specified uncompressed LAS formats. The user declares the projected input CRS, metre units and whether Z is already normalized height above ground. A normalized-height input does not produce terrain, DSM or CHM products.
03 / Area measurements
Terrain and forest structure.
The selected grid is north-up, metre-based and snapped to resolution. The current preliminary definitions are explicit; they should be matched exactly when comparing another implementation.
| Product / family | Current definition |
|---|---|
| Terrain model (DTM) | Mean elevation of class-2 ground returns in each supported cell. Missing support is filled from ground-supported neighbouring cells within two cells using inverse squared distance in grid coordinates. Cells without support remain NoData. |
| Surface and canopy height | DSM is the maximum selected-return elevation. CHM = max(0, DSM − DTM) when both are supported. This is a cell-maximum surface, without pit-free reconstruction or smoothing. |
| Height distributions | Heights above the declared terrain use selected all/first returns at or above the minimum metric height. Percentiles use type-7 linear interpolation at index (n − 1)p. Mean, sample variance/SD, CV, population-moment skewness and excess kurtosis follow the exported definitions. |
| Cover | Return-based cover is the percentage strictly above the cover threshold, retaining valid selected returns in its denominator. All-return and first-return denominators are reported separately. It is not a direct measurement of leaf area or fuel loading. |
| Return density | Selected-return count divided by cell area. This is return density, not pulse density. Boundary cells summarize the AOI-included returns and can extend beyond the polygon. |
| Intensity | Raw source intensity summaries are uncalibrated. Sensor, flight, range and processing differences require separate harmonization before cross-acquisition interpretation. |
CHM = max(0, DSM − DTM)Valid surface and terrain support requiredcover = 100 × N(h > threshold) / N(valid)Return-based percentage with its declared denominatorQ(p) at (n − 1)pLinear interpolation between ordered height samplesSingleton sample variance/SD and some zero-denominator measures are undefined. Cells lacking terrain support retain NoData height metrics. The map’s raster preview uses an approximate image-extent reprojection; exported GeoTIFFs retain the exact projected grid.
04 / Canopy peaks and crown support
Fast individual-tree exploration.
Tree detection operates on one full canopy-height raster, preferably 0.5–2 m cells in a supported metre UTM CRS. An imported CHM requires a declaration that values mean canopy height above ground in metres. A coarse raster can merge neighbouring crowns and omit shorter trees.
- Locate peaks. Two separable sliding maximum filters implement a fixed square local-maximum search. Equal-height connected candidate plateaus collapse deterministically to one peak.
- Grow crown regions. Protected seeds enter an eight-neighbour highest-bottleneck-priority flood, bounded by minimum absolute/relative height and seed-centred maximum crown radius.
- Describe raster support. Assigned CHM pixels supply height summaries, area, centroid, extent, equivalent diameter, perimeter and compactness. Polygonization follows exact pixel edges, preserving holes and multipart support.
- Review and export. Coarse-grid, flat-top, edge/gap and crown-bound flags identify algorithm conditions. CSV/WKT, treetop/crown GeoJSON, crown-ID GeoTIFF and provenance preserve the result.
Point-viewer tree colours associate eligible preview returns by projected XY crown footprint. Matching source provenance enables automatic application; an unlinked real CHM needs acquisition/CRS review. Ground, buildings, noise and unassigned returns stay neutral.
These are canopy peaks and approximate crown regions, not field-validated stem counts, species, DBH, biomass or validated 3D point segmentation. IDs belong to one run; separate tiles and dates are not reconciled. The method is an independent PRISM implementation, not a port of a lidR tree algorithm.
05 / Time
Compare compatible measurements on an exact grid.
The dated-source workspace processes two or three acquisitions sequentially using a frozen study area, grid and metric settings. Verified dates, source units and vertical references are reviewed before processing. Existing single-band GeoTIFFs can also be compared.
Change is later (B) − earlier (A), evaluated only on shared valid pixels. CRS, dimensions, origin, resolution and alignment must match. NoData in either input stays NoData. There is no automatic resampling, spatial/vertical registration or uncertainty estimate.
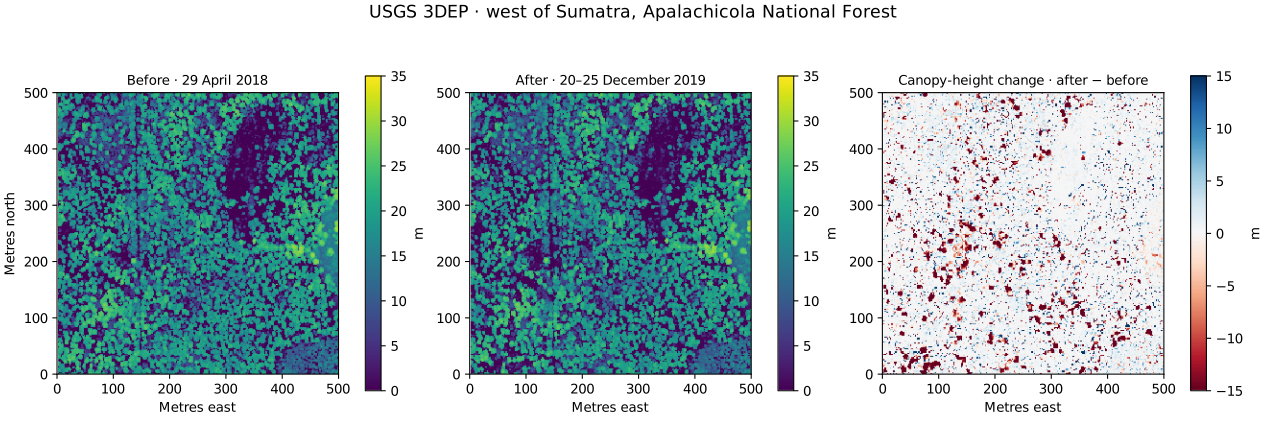
Density, canopy season, view geometry, classification, ground support, datum differences, growth and management can all affect a difference. In a hurricane study landscape, canopy loss is evidence of structural change; it does not by itself separate storm damage from salvage logging or assign a disturbance cause.
Cover differences use percentage points; return-density differences use returns/m²; height-product differences use metres. A preloaded prepared comparison and a local rerun must retain their own provenance and execution context.
06 / Large areas
Bounded tiles with verified completed work.
One acquisition is divided into balanced starting tiles on one fixed study grid. The target side of a starting tile is 500 m at cell sizes of 2 m and coarser and 383 m at 1 m cells, where a tile with its border must stay within 150,000 grid cells. The tile dialog states the target and the starting tile sizes for the current study area. The grid assigns each cell to one tile. Two-cell terrain borders retain neighbouring ground support; only owned interior cells contribute to saved products and tile statistics.
Each completed tile writes seven GeoTIFF products, cell CSV, provenance and a completion marker. Checksums, saved configuration, source metadata and a computational fingerprint are verified before resume skips completed work. Edited completed outputs are preserved and stop resume.
Splittable resource limits trigger smaller tiles. An oversized indivisible node, unavailable storage or network error can stop the job with completed outputs retained. Recovery is at complete-tile boundaries; partial downloads and interrupted metric passes restart that tile. Whole-area percentiles are not created by averaging tile percentiles.
The current queue uses one worker and can repeat source-node reads/decodes in neighbouring buffers. Shared caching, hardware-adaptive concurrency, cross-tile crown reconciliation and tiled multi-date orchestration remain development work.
07 / Reproducibility
Keep the analysis record with the products.
Analysis exports combine projected Float32 GeoTIFFs, grid CSV, the AOI and versioned provenance. Provenance identifies source URLs/metadata, downloaded-node or local-file SHA-256 checksums, grid, units, parameters, accepted-point counts and method definitions. Tree and dated outputs have their own export workflows; tiled products remain in the chosen local folder.
Raster NoData is represented explicitly; it does not mean zero canopy height. Crown-ID rasters use positive result-local IDs, zero for valid unassigned background and an explicit NoData value. Some vector/export limits can leave complete raster/statistical results available while explaining omitted polygons.
Use GeoTIFFs for exact coordinate/grid work and inspect the products in a desktop GIS as part of review. Save outputs before closing the browser. Public provider, basemap and search requests are separate from the browser-local file/metric workflow.
08 / Resource budgets
Explicit limits, without silent sampling.
| Workflow | Current engineering bounds |
|---|---|
| Ordinary cloud/date acquisition | Up to 1.01 km² and 150,000 grid cells, counted over the rectangle that encloses the study area; 25M candidate / 20M accepted returns; 4,000 data nodes; 5,000 requests; 512 MiB response-body data. For a single acquisition, a study area over the area or grid-cell limit runs as tiles; the multiple-date workflow has no tiled route. Source density and individual-node limits can stop a run that is within both. |
| Individual source node | 32 MiB compressed, 1M returns and 64 MiB decoded limits. Unsupported ranges fail rather than triggering a whole-acquisition fallback. |
| Local point file | 40 MB and 250,000 returns. General local compressed LAZ import is not available in this release. |
| Imported raster | Single-band numeric, north-up, pixel-is-area GeoTIFF; 40 MB and 4M pixels per file. |
| Individual trees | 2M CHM pixels, 50,000 peaks, at most 64 search pixels per axis. Polygonization/export also have explicit edge/ring/byte limits. |
| Tiled job | Up to 1,000 km², 250 km projected span per axis and 4,096 tiles. The tile count is checked on the starting tiles, counted over the rectangle that encloses the study area, and again after any tile is split. Each buffered tile has its own resource limits, and a tiled job needs native desktop folder and lock capabilities. |
| Temporary memory fallback | 32 MiB. Larger point spools need available OPFS site storage. A crash can leave temporary browser-storage files. |
Budgets guard transfer, storage and processing. Exceeding a limit stops or explicitly subdivides eligible work; it does not silently calculate full-area metrics from the viewer sample.
After a study area is drawn or imported, a note under the step 2 heading states how a public-source analysis of that area has to run. It is worked out from the area and the cell size alone, before any request is made. An area of at most 1.01 km² whose grid has at most 150,000 cells fits one run, and a finished run opens in the map. An area over either limit needs tiles: the note gives the number of starting tiles and, in desktop Chrome or Edge, Use this source then opens the tile dialog. Tiled results are files in a folder and do not open in the map. Running tiles needs desktop Chrome or Edge; in another browser the note says that tiles cannot run there. Where the area is within 1.01 km² and a larger cell size would bring the grid within 150,000 cells, the note names that cell size; cell size is set under Advanced options and changes every product. An area over the tiled-job limits cannot be processed with those settings, and the note states those limits.
The note covers area and grid size only. A source that holds more data over the area than one run allows stops the plan or the run, and no partial result is kept; where smaller pieces can get past that limit, tiles are then offered in desktop Chrome or Edge. The prepared example shows no note, and a local point file that is loaded runs in step 3 whatever the note says.
09 / Evidence and interpretation
Engineering verification is one part of validation.
A real USGS Pole Creek EPT engineering run accepted 11,761,381 returns. Independent laspy/lazrs, PROJ, NumPy and GDAL calculations checked source counts/hashes, declared height/cover statistics and five georeferenced raster products. A separate full COPC AOI check included explicit US survey foot conversion. Buffered archived-data replay matched all seven untiled products on its test study.
These numerical and adapter checks were run in managed Linux/Node and independent Python tools. They are not Windows Chrome/OPFS throughput measurements, maximum-speed guarantees, native browser filesystem acceptance or field accuracy estimates. Published timings apply to the recorded fixture and environment.
FUSION/lidR metric-by-metric parity, broader terrain/forest reference datasets, field-labelled tree accuracy, cross-date registration and uncertainty remain separate validation work. Browser readiness checks exercise a tiny synthetic fixture; they do not certify a full-size real-data run.
Canopy height, cover, return density and dated differences can support a separately validated study. Dedicated vertical strata, qualified ladder-fuel indicators and calibrated fuel models are future work. The current release does not estimate fuel mass, canopy bulk density, validated canopy base height, fire spread or fire severity.
10 / Source material
Data and methodological references.
- USGS 3D Elevation Program (opens a new tab) — source-program context and access.
- USGS 3DEP LiDAR on AWS (opens a new tab) — public point-cloud access and source catalogue context.
- 2018 USGS Florida Panhandle acquisition metadata (opens a new tab) — original acquisition period and coordinate/unit context; inspect the specific distribution used.
- FUSION manual (opens a new tab) — reference definitions to audit; numerical equivalence has not been established.
- lidR methods book (opens a new tab) and individual-tree detection guide (opens a new tab) — methodological background, not a claim that PRISM ports these implementations.
The project’s GitHub repository preserves source, tests, reference PDFs and detailed engineering reports. Each exported analysis retains the data and method context needed for review; the software citation does not replace those acquisition/method citations.
Release & attribution
Cite PRISM
Record the software version alongside the original acquisition, method definitions and analysis settings.
Broadbent, E. N., Drake, J. B., Medley, P., & Almeyda Zambrano, A. M. (2026). PRISM: A browser-based, cross-platform environment for LiDAR and remote-sensing analysis (Version 2.3) [Computer software]. https://prismlidar.app
Developed with support from the Apalachicola Regional Restoration Initiative (ARRI) and the Partnership for Remote Inventory and Stand Management (PRISM) of the U.S. Department of Agriculture, Forest Service and SPECLab internal research funds. Portions of the software development and documentation were completed with assistance from AI tools under the direction of the PRISM development team. The team is responsible for reviewing and verifying these contributions. Validation status and remaining limits are described in the Methods. Development continues with support through ARRI and SPECLab internal research funds.
- Project initiated
- September 2021
- Software
- Version 2.3 · Research preview
- Release date
- November 11, 2026
- Project lead
- Eben N. Broadbent
- Website
- prismlidar.app