PRISM 2.3 · Research preview · reviewed 2026-11-11
PRISM workflow manual
Project initiated September 2021. PRISM was initiated through the U.S. Forest Service Partnership for Remote Inventory and Stand Management (PRISM) project in September 2021.
Follow a workflow in order, then inspect and export its results. Screenshots show the actual app in Windows Chrome. Open any image at full size for detail; captions distinguish completed results from controls shown before running. In the application, Help → Workflow manual (F1) can highlight the corresponding live control with an arrow.
Explore real USGS 3DEP acquisitions before and after Hurricane Michael.
Before you start: The prepared Sumatra demo loads each time the page opens. It contains two measured acquisitions; export current work before reloading the example. A study area from an earlier visit is not opened in its place: a notice above the viewer offers to restore it (the area and its settings, without point data), and Project → Restore last study area does the same.
1. Make room for the workspace
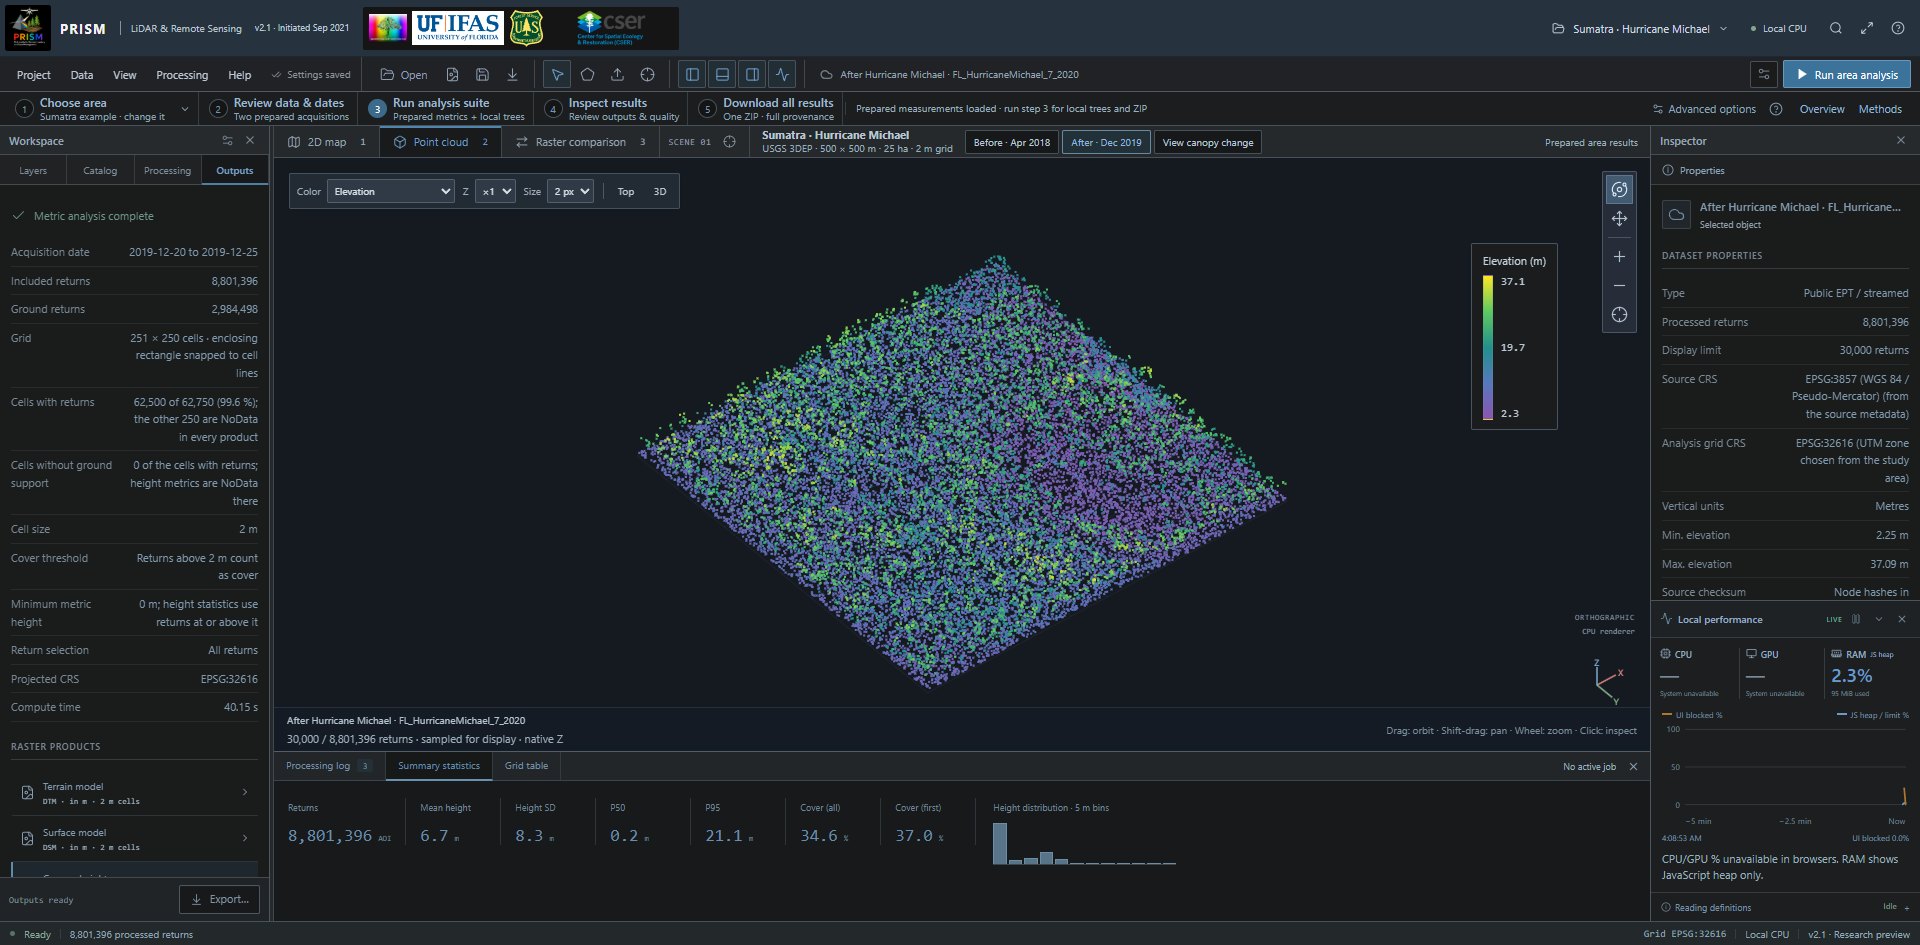
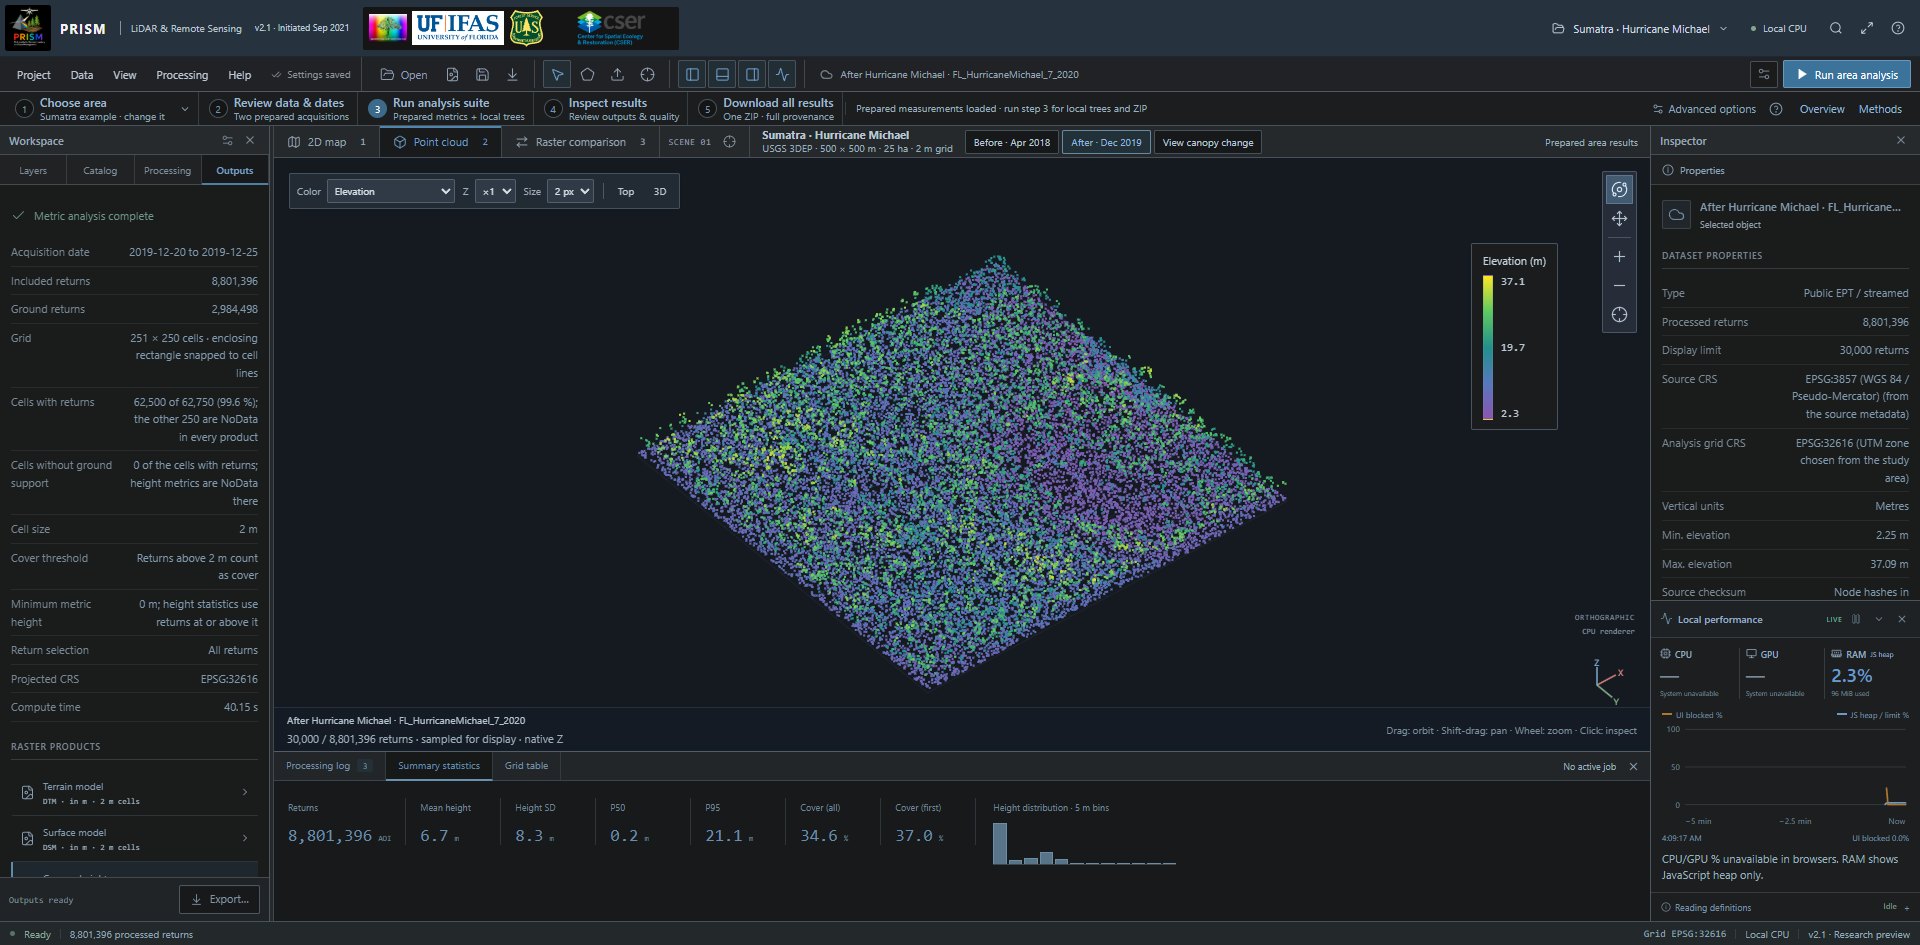
The real Sumatra workspace, with dated point-cloud preview, five analysis steps and toolbar controls. Open full-size screenshot (1920 × 945 px) Full-size image: https://prismlidar.app/manual-screenshots/workspace.jpg Captured 2026-11-11 on build a80a470a057e · PRISM 2.1. Use the in-app manual to highlight the live control.
Do this
Maximize the browser, or select Full-screen workspace in the title bar.
What it does
Gives the map, point viewer, panels and processing console more space. Esc exits browser full screen.
What to expect
A desktop-style workspace with Project, Data, View, Processing and Help menus.
2. Load or reload the real example
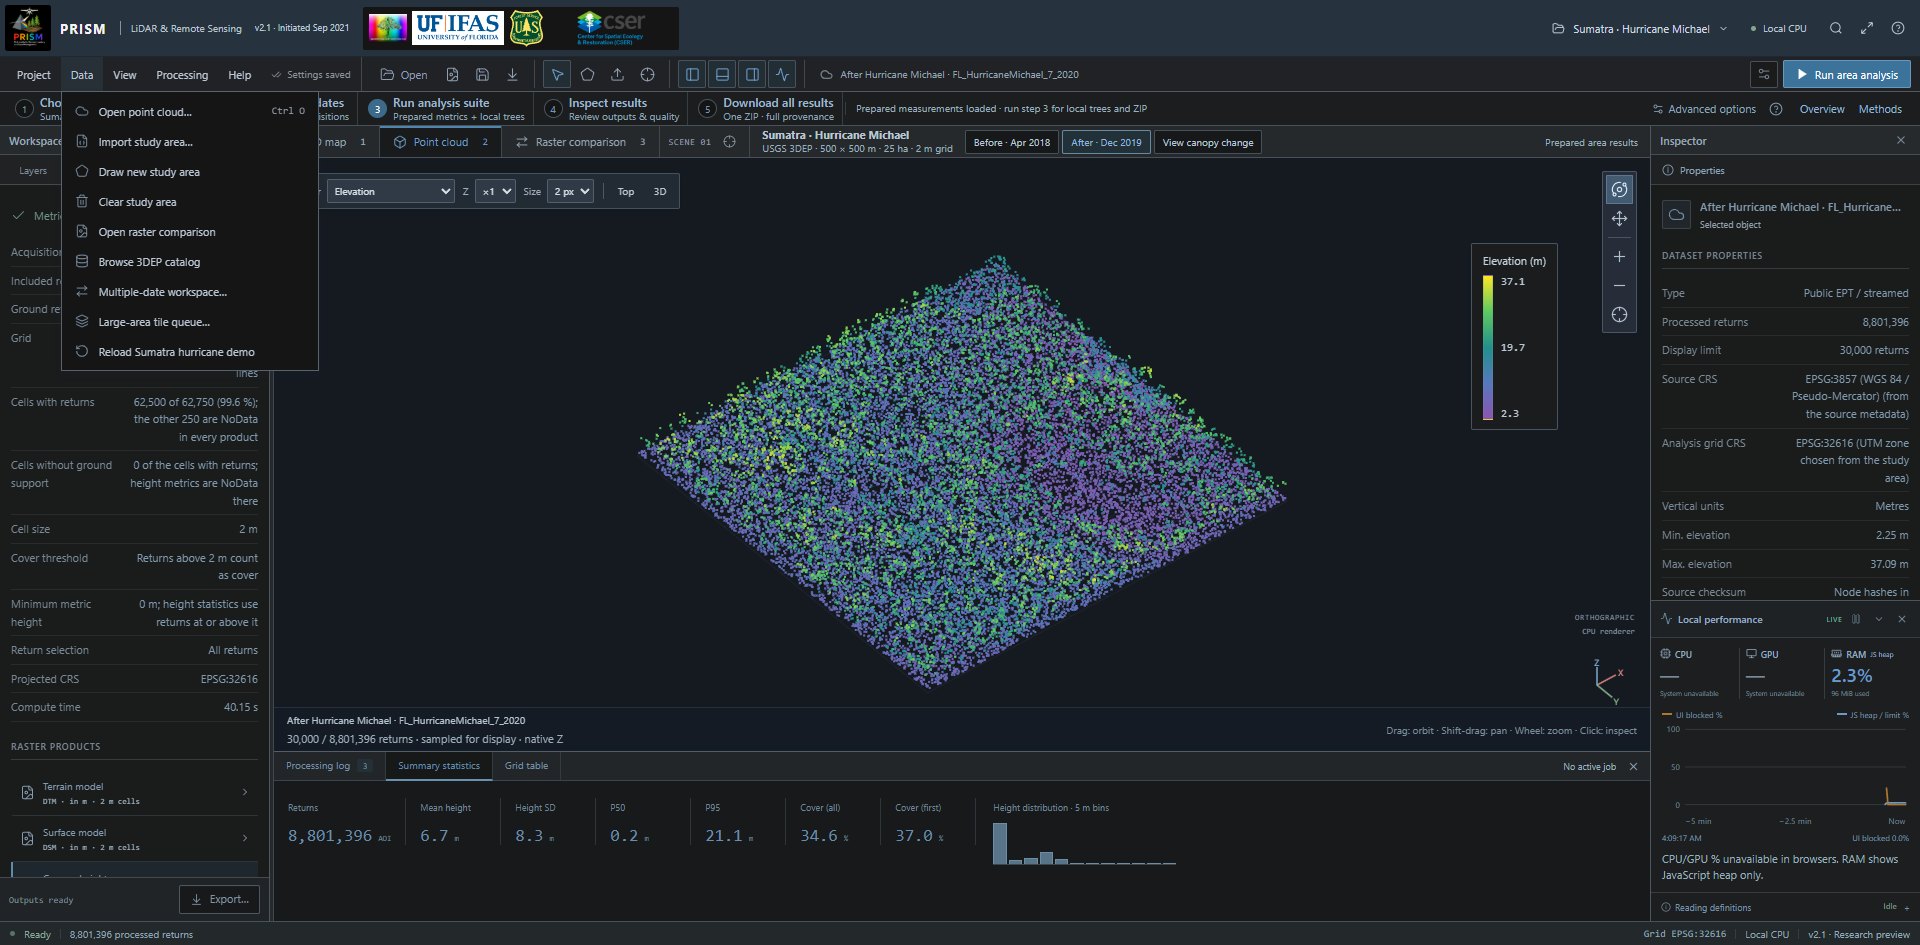
The Data menu: Open point cloud, Import study area, Draw new study area, Clear study area, Open raster comparison, Browse 3DEP catalog, Multiple-date workspace, Large-area tile queue and Reload Sumatra hurricane demo. Open full-size screenshot (1920 × 945 px) Full-size image: https://prismlidar.app/manual-screenshots/data-menu.jpg Captured 2026-11-11 on build a80a470a057e · PRISM 2.1. Use the in-app manual to highlight the live control.
Do this
Open Data and choose Reload Sumatra hurricane demo.
What it does
Loads the same 500 m square west of Sumatra, Florida: 29 April 2018 before Michael and 20–25 December 2019 after it. Both complete area results and sampled point previews are prepared from real USGS data.
What to expect
Before, After and View canopy change buttons. Prepared area results were computed during demo preparation, not on this device; full raw-source reruns are available in Processing.
3. Inspect the actual point preview
The real Sumatra workspace, with dated point-cloud preview, five analysis steps and toolbar controls. Open full-size screenshot (1920 × 945 px) Full-size image: https://prismlidar.app/manual-screenshots/workspace.jpg Captured 2026-11-11 on build a80a470a057e · PRISM 2.1. Use the in-app manual to highlight the live control.
Do this
In the Point cloud tab, change the Color list; drag to orbit, Shift-drag to pan and use the wheel to zoom. Click a return to inspect it.
What it does
Changes the display of a bounded point sample. The full accepted source supplies processing metrics independently.
What to expect
Measured point-cloud views with elevation, classification and intensity modes. The before/after controls retain matching full-source provenance; use two fingers to pan or zoom on touch devices.
4. Review the prepared analysis and local workflow
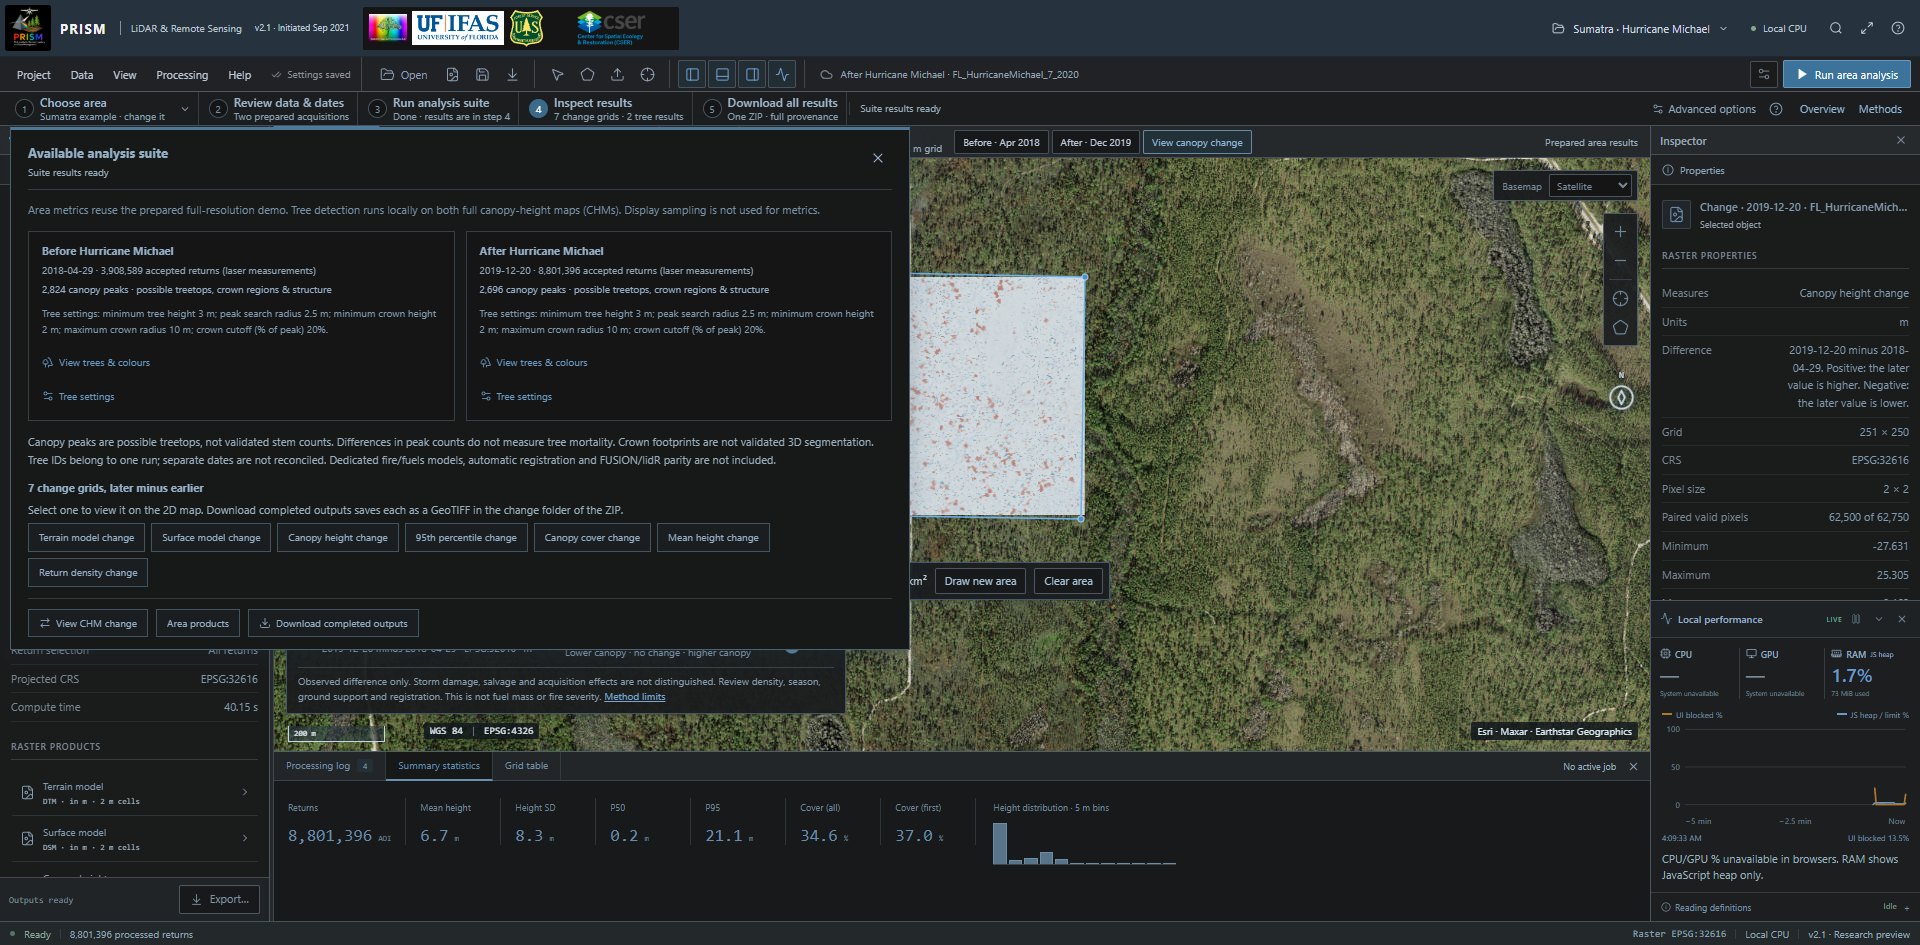
The completed prepared suite, including both dates, tree counts, default settings and validation limits. Open full-size screenshot (1920 × 945 px) Full-size image: https://prismlidar.app/manual-screenshots/suite-summary.jpg Captured 2026-11-11 on build a80a470a057e · PRISM 2.1. Use the in-app manual to highlight the live control.
Do this
For the prepared example, review its two acquisitions in step 2 and choose Run analysis suite in step 3. For a new area, use Choose area, then choose a source in step 2 and confirm its units. Run analysis in step 3 downloads the data and computes area metrics; Add tree analysis is optional afterward. Inspect results in step 4 and download them in step 5. On narrow screens, scroll the numbered strip to reach all five steps.
What it does
Area measurements were prepared from all accepted laser returns independently of the sampled viewer. Local tree analysis runs on each full canopy-height map (CHM). Canopy peaks are possible treetops, not validated stem counts. Their count difference does not measure mortality; tree IDs do not match trees across dates.
What to expect
Prepared outputs remain clearly labelled. Canopy change does not automatically identify hurricane damage or salvage logging; source density, acquisition season and registration also matter.
Retrieve real USGS 3DEP data
Define an area, plan the complete source hierarchy and process accepted returns.
Before you start: Internet access and a public EPT/COPC source allowing browser requests. One run holds up to 1.01 km² and 150,000 grid cells, counted over the rectangle that encloses the study area: at 2 m cells that is at most 0.6 km², and less for an area that does not fill its rectangle. A larger area runs as tiles. Point, node, storage and transfer limits also apply.
5. Define the study area
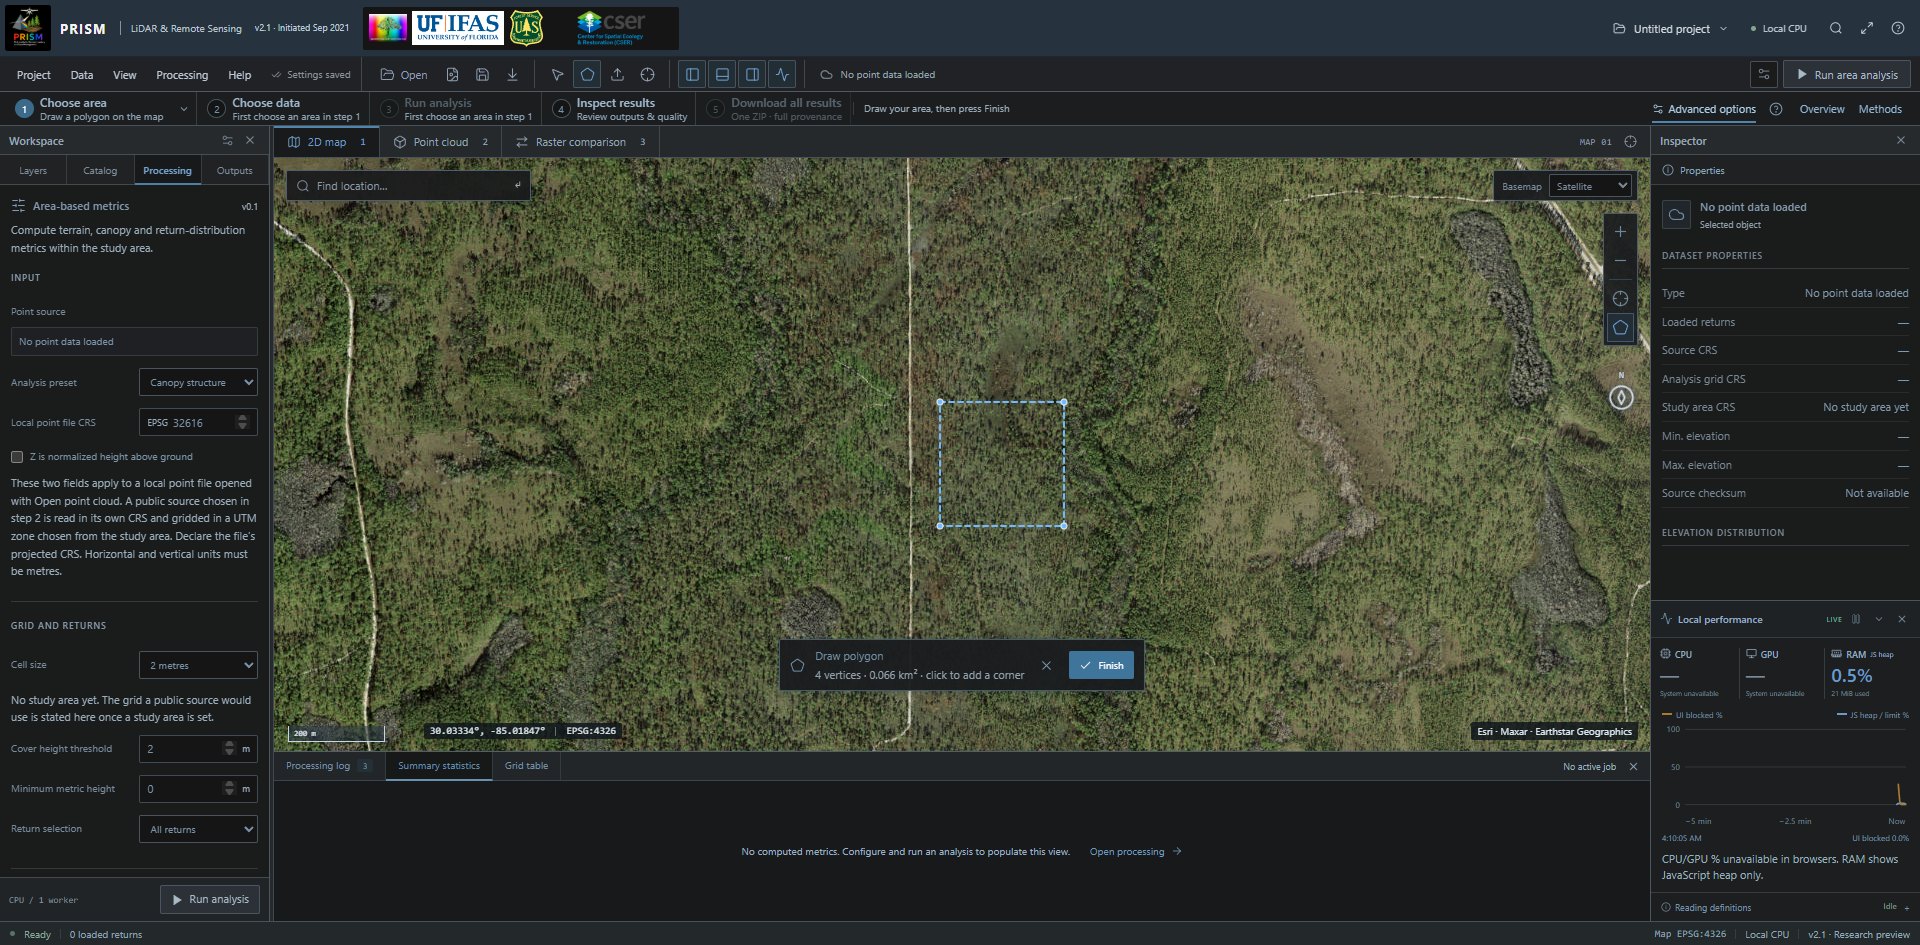
Four vertices drawn in the actual map; Finish completes the polygon and opens source selection. Open full-size screenshot (1920 × 945 px) Full-size image: https://prismlidar.app/manual-screenshots/draw-area.jpg Captured 2026-11-11 on build a80a470a057e · PRISM 2.1. Use the in-app manual to highlight the live control.
Do this
In 2D map, select Draw study area, click at least three polygon corners and select Finish; alternatively use Import study area for a WGS84 GeoJSON or KML polygon.
What it does
Sets the exact point-membership boundary, including supported polygon holes.
What to expect
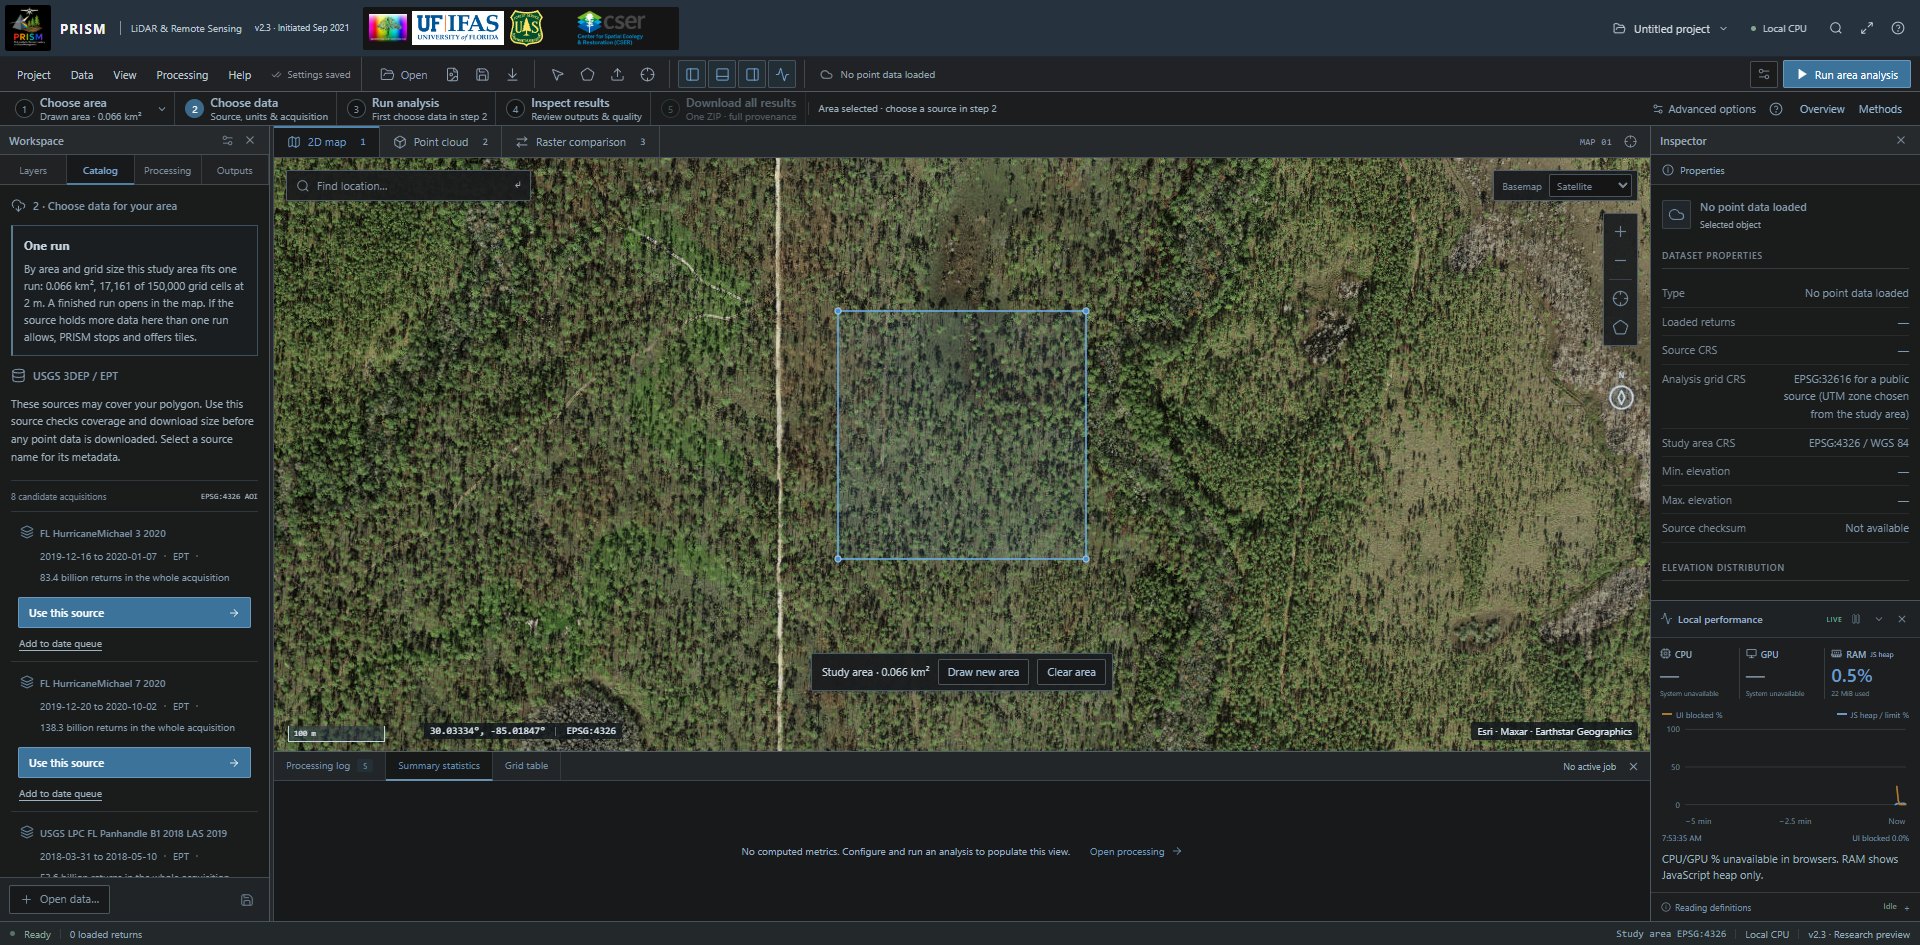
A study-area outline and candidate catalog acquisitions. A source bounding box does not prove full coverage. A bar at the bottom of the 2D map then gives the study area's size, with Draw new area and Clear area: a new drawing replaces the study area only on Finish, and Clear area removes it.
6. Choose a real source
The actual acquisition catalog after drawing a new polygon: the step 2 note, then each source with its USGS collection window, Use this source and Add to date queue. On the map, the study-area bar offers Draw new area and Clear area. Open full-size screenshot (1920 × 945 px) Full-size image: https://prismlidar.app/manual-screenshots/catalog.jpg Captured 2026-11-11 on build e7f0689a4426 · PRISM 2.3. Use the in-app manual to highlight the live control.
Do this
Open Catalog and read the note under the step 2 heading. On an intersecting acquisition, select Use this source. For an address of your own, use Open a public EPT / COPC URL, under Other ways to get data below the source list.
What it does
For a one-run area, reads source metadata and the complete intersecting hierarchy before downloading point nodes. For an area that needs tiles, in desktop Chrome or Edge it opens the Large-area tile queue with that source selected and reads its reference; tiled results are files in a folder and do not open in the map. In a browser without local folder access it states that tiles cannot run there.
What to expect
After you draw or import a study area, the note states whether it fits one run, needs tiles or is over the limits; the prepared example shows no note. Before a study area is set, the note says so and no sources are listed. Where the area needs tiles only because its grid has too many cells and a larger cell size would fit one run, the note names that cell size; cell size is set under Advanced options. Use this source gives a download plan, or a specific resource/coverage error. When the stop is a limit that tiles can solve, a Process in tiles action is offered in desktop Chrome or Edge. Reload Sumatra hurricane demo restores both prepared acquisitions and the real point previews. Each source row gives the collection window of the source's whole USGS work unit (USGS record) where the catalog has one for the source, otherwise the year inferred from the source name; neither is the flight date of your study area.
7. Review the plan and source units
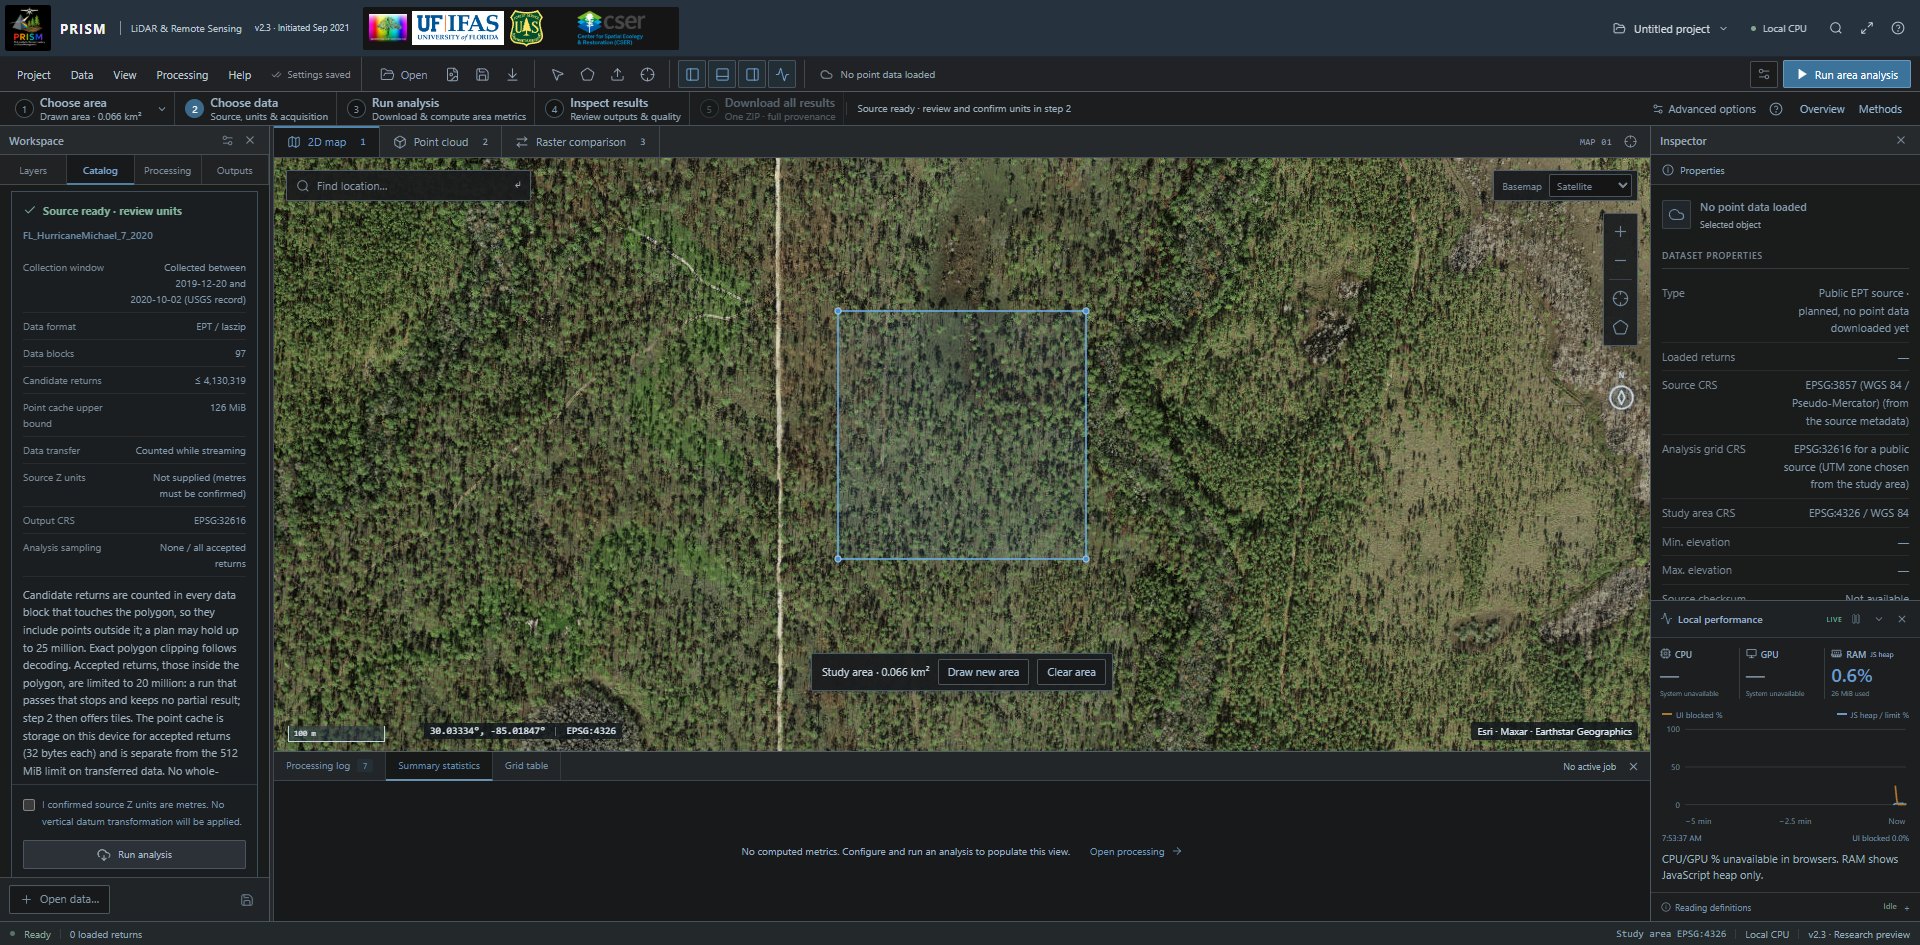
A real 97-block EPT plan for the newly drawn polygon; its first row is the source’s USGS collection window. The metre-Z confirmation gates the Run analysis action. Open full-size screenshot (1920 × 945 px) Full-size image: https://prismlidar.app/manual-screenshots/source-plan.jpg Captured 2026-11-11 on build e7f0689a4426 · PRISM 2.3. Use the in-app manual to highlight the live control.
Do this
After planning succeeds, review Source ready · review units, source Z units, reference information, node counts and output CRS. Confirm metre Z units only if independently known when metadata omits them.
What it does
Declared length units convert to metres. The output uses an automatic UTM grid; there is no vertical datum transformation.
What to expect
Run analysis becomes available after required review. This panel appears only after a successful plan. For a catalog source that has a collection window, the first row of the plan gives it.
8. Download and process
A real 97-block EPT plan for the newly drawn polygon; its first row is the source’s USGS collection window. The metre-Z confirmation gates the Run analysis action. Open full-size screenshot (1920 × 945 px) Full-size image: https://prismlidar.app/manual-screenshots/source-plan.jpg Captured 2026-11-11 on build e7f0689a4426 · PRISM 2.3. Use the in-app manual to highlight the live control.
Do this
In the reviewed plan select Run analysis. Keep the tab open; use Cancel if necessary.
What it does
Fetches intersecting EPT nodes or COPC byte ranges, decodes locally, clips points exactly and processes all accepted returns. A separate sample supplies the viewer.
What to expect
Local progress and outputs with source/node checksums. NoData may indicate missing coverage or ground support; it is not zero canopy height.
9. Inspect and export the result
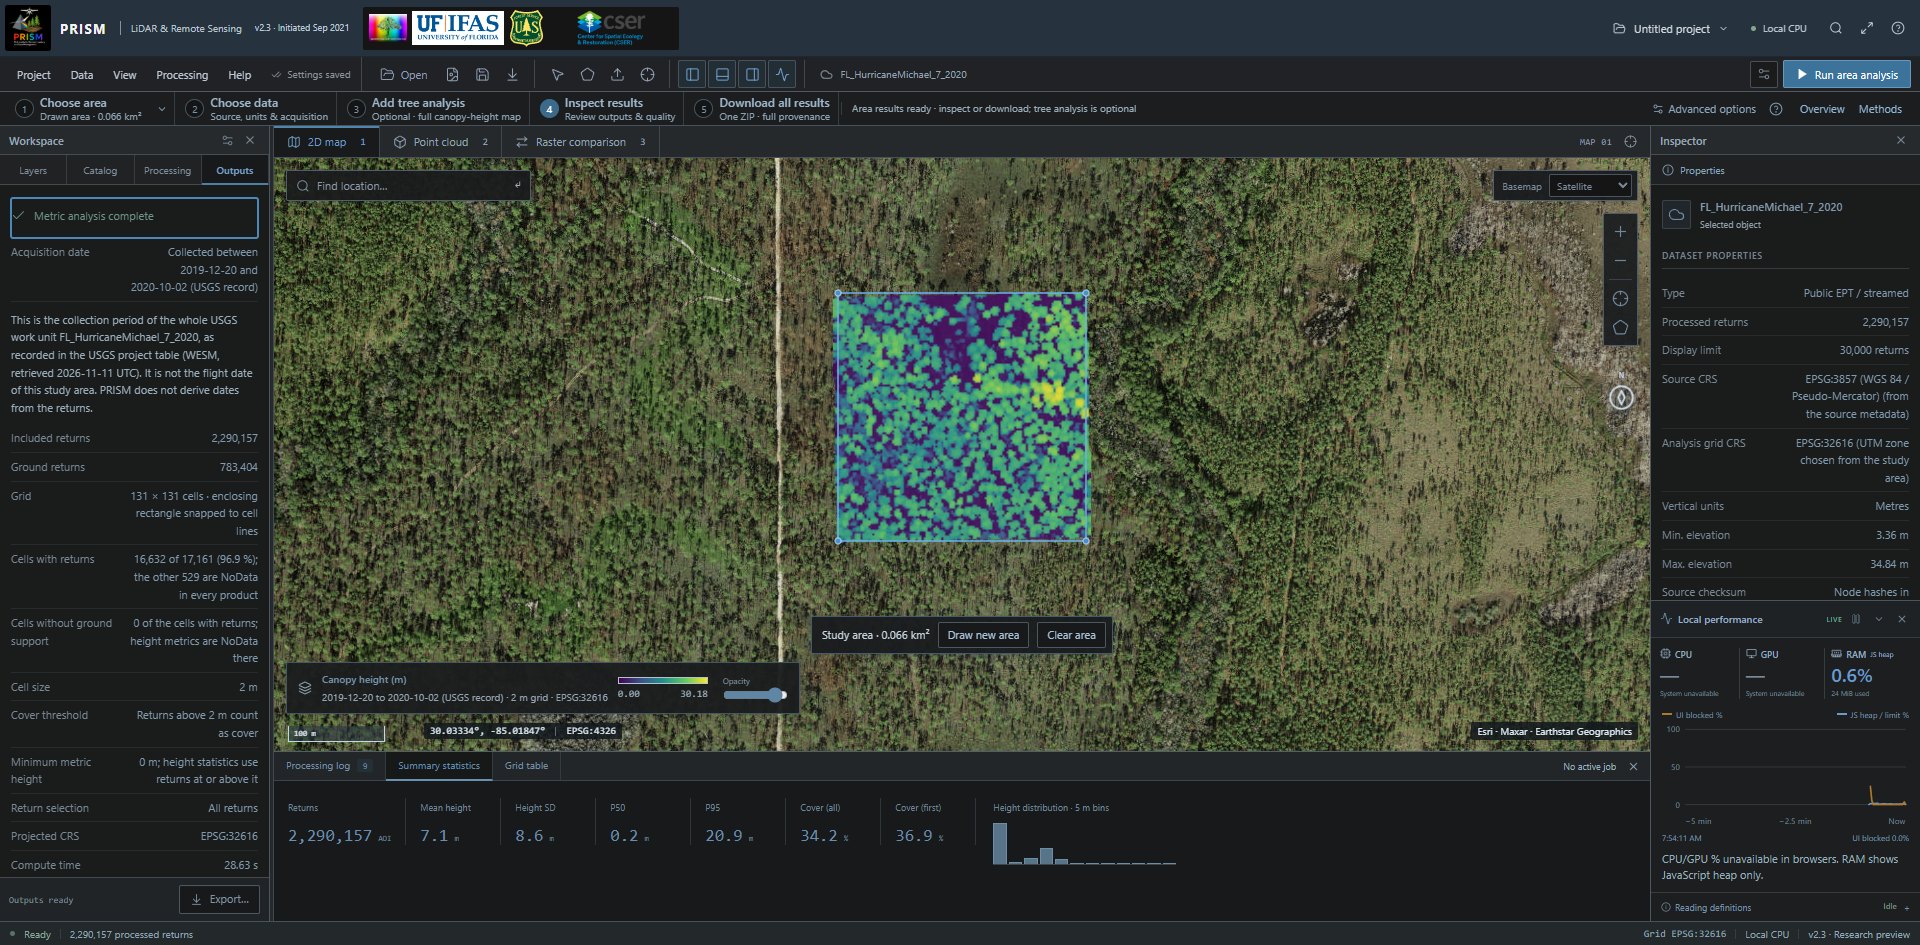
A new polygon processed 2,290,157 real returns on a 131 × 131, 2 m grid. Acquisition date gives the source’s USGS collection window with the note that says what it is, and the map legend repeats the dates. Outputs are independent of viewer sampling. Open full-size screenshot (1920 × 945 px) Full-size image: https://prismlidar.app/manual-screenshots/cloud-result.jpg Captured 2026-11-11 on build e7f0689a4426 · PRISM 2.3. Use the in-app manual to highlight the live control.
Do this
Review Raster products, quality messages and the map. The summary above the products gives the cells with returns, the cells without ground support and the cover threshold, minimum metric height and return selection that produced the result. Click a cell on the 2D map to read its value and unit. Use Project → Export analysis to save the bundle.
What it does
Keeps georeferenced products, cell metrics, study area, parameters and source provenance together.
What to expect
Projected output rasters. The browser map is an approximate image reprojection; inspect exported GeoTIFFs for exact grid work. For a catalog source that has a collection window, when no exact date is known, Acquisition date reads “Collected between START and END (USGS record)”, or “Collected on DATE (USGS record)” when the record gives one day: the collection period of the source's whole USGS work unit, not the flight date of your study area. The map legend, pixel inspection and the exported provenance give the same window. Without an exact date and without a window, Acquisition date reads Not specified.
Process a local point file
Declare coordinates and height meaning before calculating metrics.
Before you start: A supported uncompressed LAS or numeric CSV in projected metre coordinates. Local input is limited to 250,000 points; local compressed LAZ is not a general import path in this release.
10. Open the point file
The Data menu: Open point cloud, Import study area, Draw new study area, Clear study area, Open raster comparison, Browse 3DEP catalog, Multiple-date workspace, Large-area tile queue and Reload Sumatra hurricane demo. Open full-size screenshot (1920 × 945 px) Full-size image: https://prismlidar.app/manual-screenshots/data-menu.jpg Captured 2026-11-11 on build a80a470a057e · PRISM 2.1. Use the in-app manual to highlight the live control.
Do this
Select Open point cloud and choose your supported LAS or CSV file.
What it does
Reads the file on this device and calculates its SHA-256. It is not uploaded by the analysis workflow.
What to expect
A measured source name and point preview. An unsupported file produces an error; do not rename a LAZ file to LAS.
11. Declare the input reference
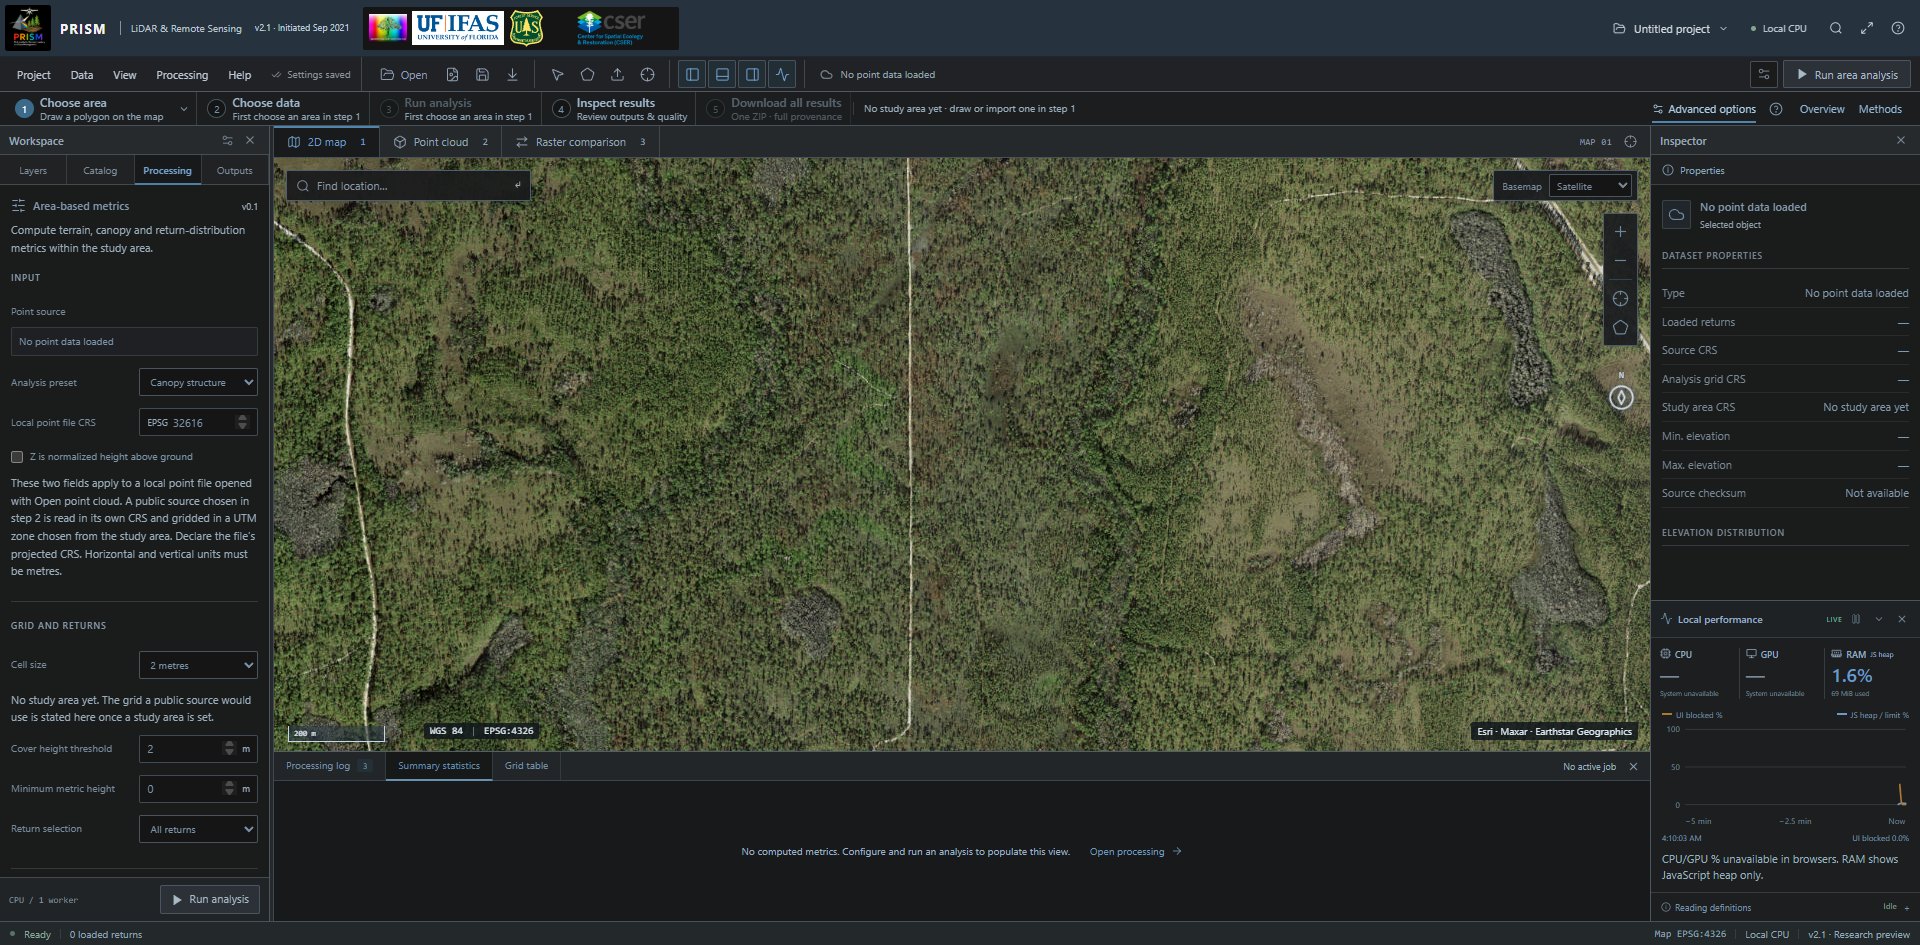
The Processing tab's fields for a local point file: its EPSG code and the normalized-height declaration. No local file is loaded and no study area is set in this screenshot. Open full-size screenshot (1920 × 945 px) Full-size image: https://prismlidar.app/manual-screenshots/local-reference.jpg Captured 2026-11-11 on build a80a470a057e · PRISM 2.1. Use the in-app manual to highlight the live control.
Do this
In Area-based metrics, enter the file's actual EPSG code and confirm both horizontal and vertical units are metres. Declare normalized height only when Z already means height above ground.
What it does
Interprets the source coordinates. Entering a different EPSG code does not convert a mislabelled file.
What to expect
For normalized heights, terrain/DSM/CHM outputs are unavailable; height-distribution metrics remain possible.
12. Choose the metric definitions
The Processing tab's fields for a local point file: its EPSG code and the normalized-height declaration. No local file is loaded and no study area is set in this screenshot. Open full-size screenshot (1920 × 945 px) Full-size image: https://prismlidar.app/manual-screenshots/local-reference.jpg Captured 2026-11-11 on build a80a470a057e · PRISM 2.1. Use the in-app manual to highlight the live control.
Do this
Set cell size, cover threshold, minimum metric height and all/first returns, then select Run area analysis.
What it does
The cover denominator retains all valid selected returns; height summaries apply the minimum height. Unnormalized terrain depends on class-2 ground returns.
What to expect
Results and quality messages. Missing ground support leaves height products NoData. Review Methods before comparing with other tools.
Process a large area in tiles
Save completed buffered tiles to a local folder and resume verified work.
Before you start: Desktop Chrome or Edge with native folder access, adequate disk space, one real acquisition and a study area within job limits. Define AOI/settings before starting.
13. Review the source and fixed grid
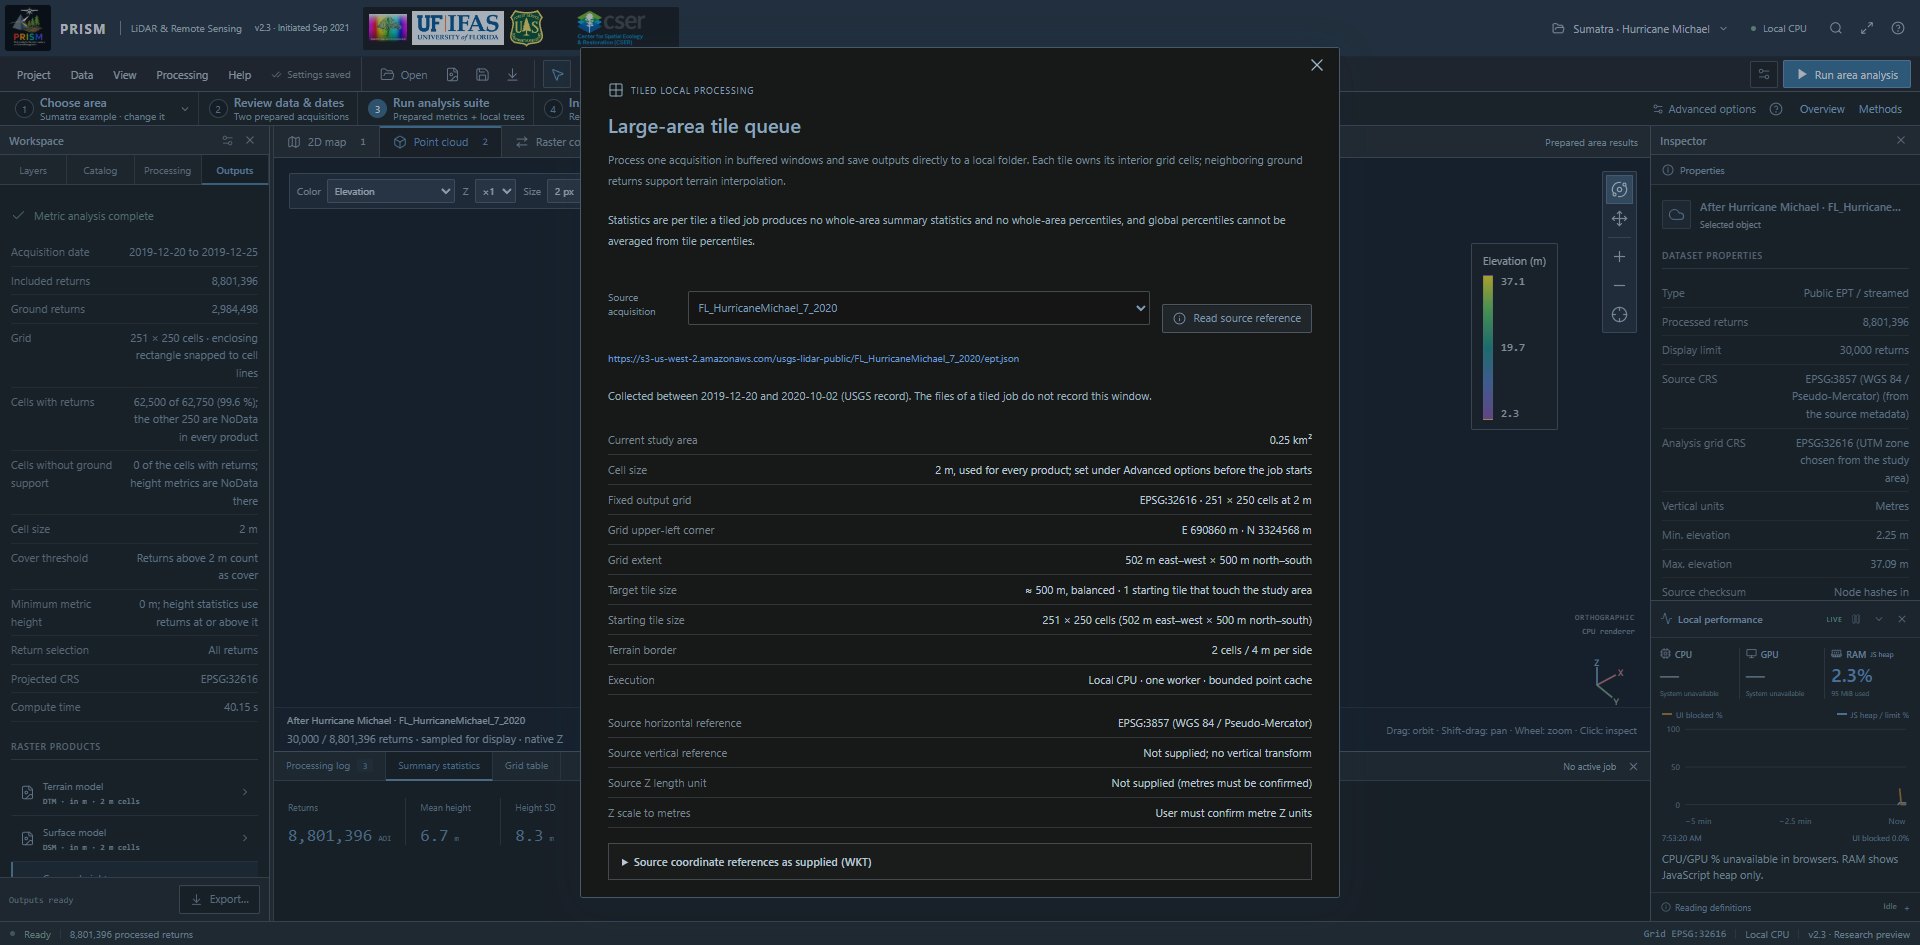
The large-area tile queue after reading a source reference: the source's USGS collection window under its address, the fixed output grid, the tile sizes and the source's coordinate references. The folder, run and resume controls are further down the dialog; no tiled job was run for this screenshot. Open full-size screenshot (1920 × 945 px) Full-size image: https://prismlidar.app/manual-screenshots/tiled-queue.jpg Captured 2026-11-11 on build e7f0689a4426 · PRISM 2.3. Use the in-app manual to highlight the live control.
Do this
Open Data → Large-area tile queue, choose Source acquisition and select Read source reference. For a study area that needs tiles, Use this source in the Catalog opens the same queue with that source selected and reads its reference for you. Review units, coverage, output grid and the review checkbox.
What it does
Freezes one acquisition, AOI and settings into the saved job. Balanced windows include a two-cell terrain border.
What to expect
A fixed UTM grid and starting tiles of about 500 m on a side (383 m at 1 m cells). Limits include 1,000 km² and 4,096 tiles, plus per-tile density and decoding limits. If you close the queue before starting the job, step 3 of the numbered strip, or Continue in tile dialog in the step 2 note, opens it again on that source. Under the source address, a line gives the source's collection window (USGS record) where one is known; the files of a tiled job do not record it.
14. Choose a folder and run
The large-area tile queue after reading a source reference: the source's USGS collection window under its address, the fixed output grid, the tile sizes and the source's coordinate references. The folder, run and resume controls are further down the dialog; no tiled job was run for this screenshot. Open full-size screenshot (1920 × 945 px) Full-size image: https://prismlidar.app/manual-screenshots/tiled-queue.jpg Captured 2026-11-11 on build e7f0689a4426 · PRISM 2.3. Use the in-app manual to highlight the live control.
Do this
Select New output folder & run, choose an appropriate output folder and grant the browser folder permission.
What it does
Processes one buffered tile at a time and writes interior GeoTIFFs, metrics and provenance. Only complete, checksummed tiles are marked finished.
What to expect
Saved tile counts and progress. Oversized splittable tiles subdivide; an indivisible resource limit can stop the job. Hardware-adaptive parallel workers are not implemented.
15. Pause or restart safely
The large-area tile queue after reading a source reference: the source's USGS collection window under its address, the fixed output grid, the tile sizes and the source's coordinate references. The folder, run and resume controls are further down the dialog; no tiled job was run for this screenshot. Open full-size screenshot (1920 × 945 px) Full-size image: https://prismlidar.app/manual-screenshots/tiled-queue.jpg Captured 2026-11-11 on build e7f0689a4426 · PRISM 2.3. Use the in-app manual to highlight the live control.
Do this
Use Pause job to stop between retained work. In a later session select Resume saved folder and choose the same folder; review the saved job.
What it does
Verifies configuration, source metadata and completed files before continuing. Edited completed files are preserved and stop resume.
What to expect
Verified complete tiles are skipped. Partial transfers or a partially processed tile restart; global percentiles cannot be averaged from tile percentiles.
Detect and colour individual trees
Find CHM peaks, inspect crown regions and view matching point-cloud colours.
Before you start: A computed unnormalized CHM or a single-band projected metre CHM GeoTIFF. Prefer 0.5–2 m cells; coarse rasters and missing ground can bias detections. One raster per run.
16. Choose a canopy-height model
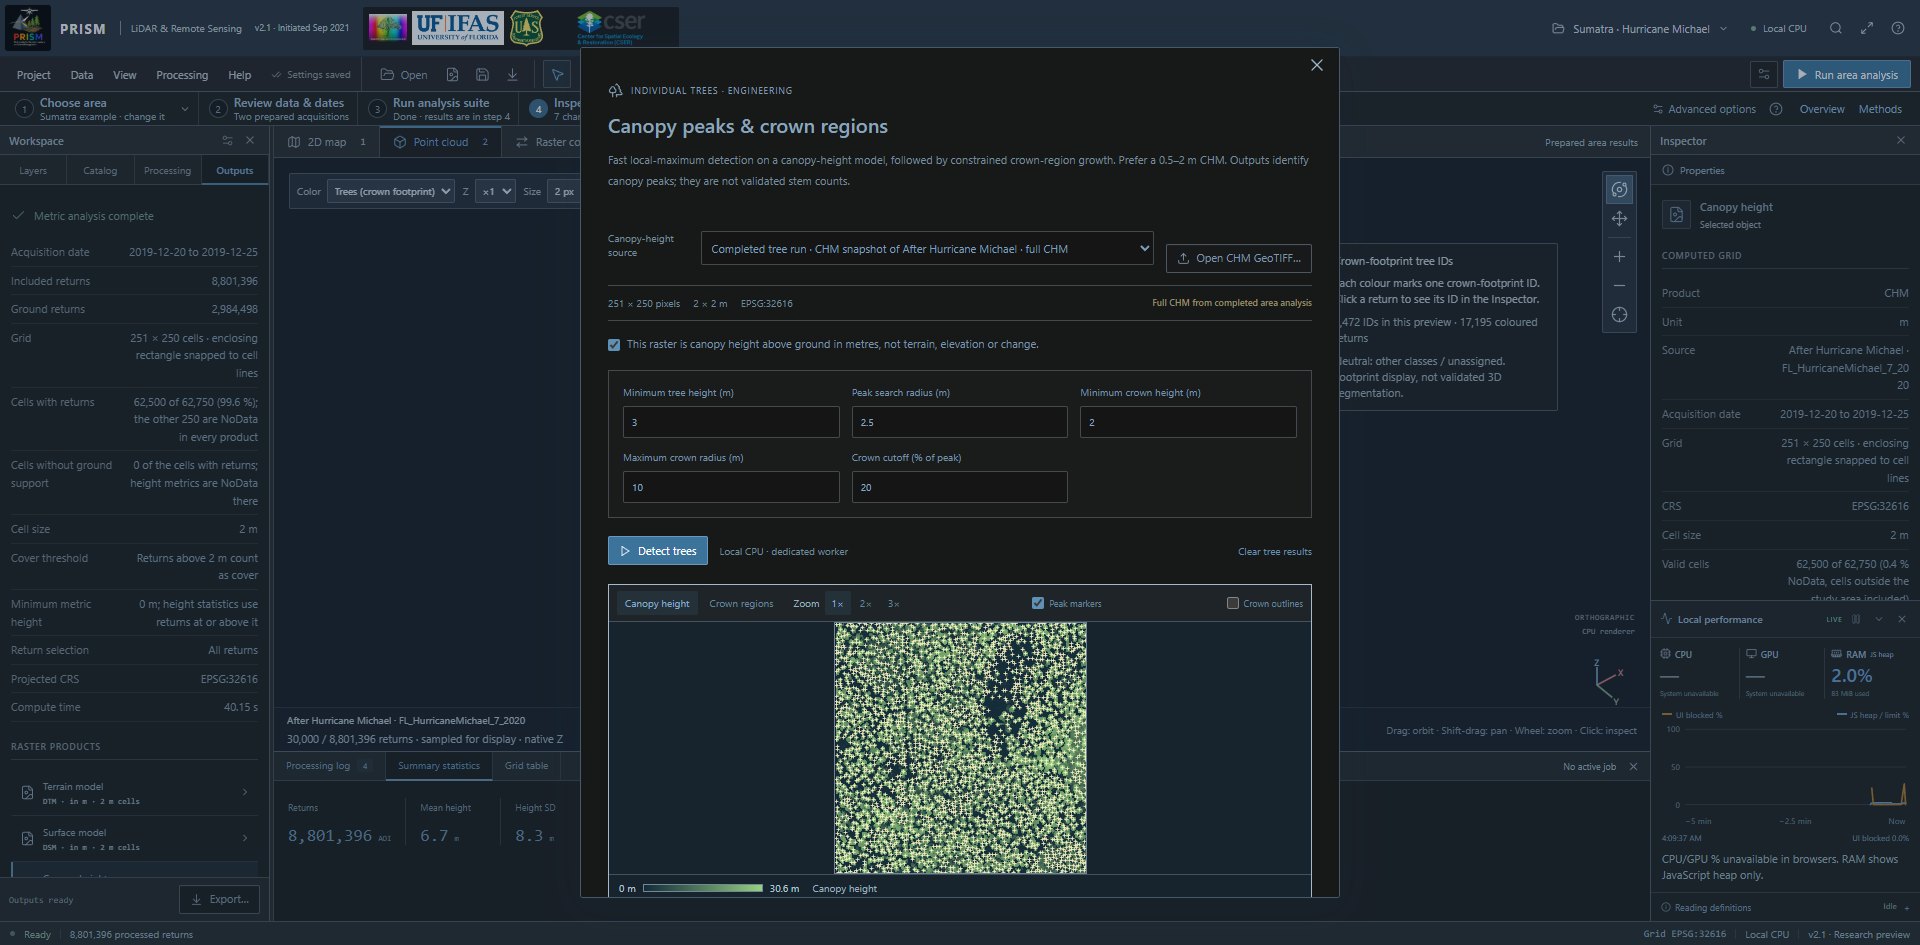
Completed after-date CHM tree analysis, showing the actual canopy-height source, detection parameters and the canopy-height preview with peak markers. Open full-size screenshot (1920 × 945 px) Full-size image: https://prismlidar.app/manual-screenshots/trees.jpg Captured 2026-11-11 on build a80a470a057e · PRISM 2.1. Use the in-app manual to highlight the live control.
Do this
Open Processing → Individual trees. Select Canopy-height source or Open CHM GeoTIFF. For imported rasters, explicitly confirm height above ground in metres.
What it does
Reads canopy height, rather than terrain, raw elevation or a change raster. The input snapshot and metadata accompany results.
What to expect
A canopy preview and grid information. Imported CHMs are not automatically linked to the open point cloud. Completed snapshots show the source identifier and the acquisition date or, where only that is known, the source's collection window (USGS record); the controls apply to the next run.
17. Set peak and crown scales
Completed after-date CHM tree analysis, showing the actual canopy-height source, detection parameters and the canopy-height preview with peak markers. Open full-size screenshot (1920 × 945 px) Full-size image: https://prismlidar.app/manual-screenshots/trees.jpg Captured 2026-11-11 on build a80a470a057e · PRISM 2.1. Use the in-app manual to highlight the live control.
Do this
Review Tree detection parameters: minimum height, peak-search radius, minimum crown height, maximum crown radius and cutoff fraction.
What it does
Uses a fixed square local-maximum search followed by constrained crown growth. The settings control peak spacing and crown extent.
What to expect
Smaller windows may split crowns; larger windows may merge nearby trees. Coarse-grid flags and edge flags require review.
18. Detect and inspect crowns
Completed after-date CHM tree analysis, showing the actual canopy-height source, detection parameters and the canopy-height preview with peak markers. Open full-size screenshot (1920 × 945 px) Full-size image: https://prismlidar.app/manual-screenshots/trees.jpg Captured 2026-11-11 on build a80a470a057e · PRISM 2.1. Use the in-app manual to highlight the live control.
Do this
Select Detect trees; after completion switch the preview to Crown regions. Use Zoom 2× or 3× to tell neighbouring peaks and crowns apart; the magnified preview scrolls inside its box. Click a crown or a tree-table ID.
What it does
Generates peak records, crown IDs, exact pixel-support polygons and CHM-pixel structure summaries in a local worker.
What to expect
Consistent per-ID colours and quality flags. These are canopy peaks and raster supports, not field-validated stems, DBH or biomass.
19. Save trees and open the viewer
Completed after-date CHM tree analysis, showing the actual canopy-height source, detection parameters and the canopy-height preview with peak markers. Open full-size screenshot (1920 × 945 px) Full-size image: https://prismlidar.app/manual-screenshots/trees.jpg Captured 2026-11-11 on build a80a470a057e · PRISM 2.1. Use the in-app manual to highlight the live control.
Do this
Use Export trees & crowns to save the ZIP. Use View coloured point cloud for the matching loaded point source. Close the tree dialog before using a guide arrow for the main viewer.
What it does
Exports CSV/WKT, treetops/crown GeoJSON, crown-ID GeoTIFF and provenance, within export limits. Results remain session-local until exported.
What to expect
Tree IDs and colours agree within this result. IDs are not identities matched across dates or separate tiles.
20. Colour point returns by crown footprint
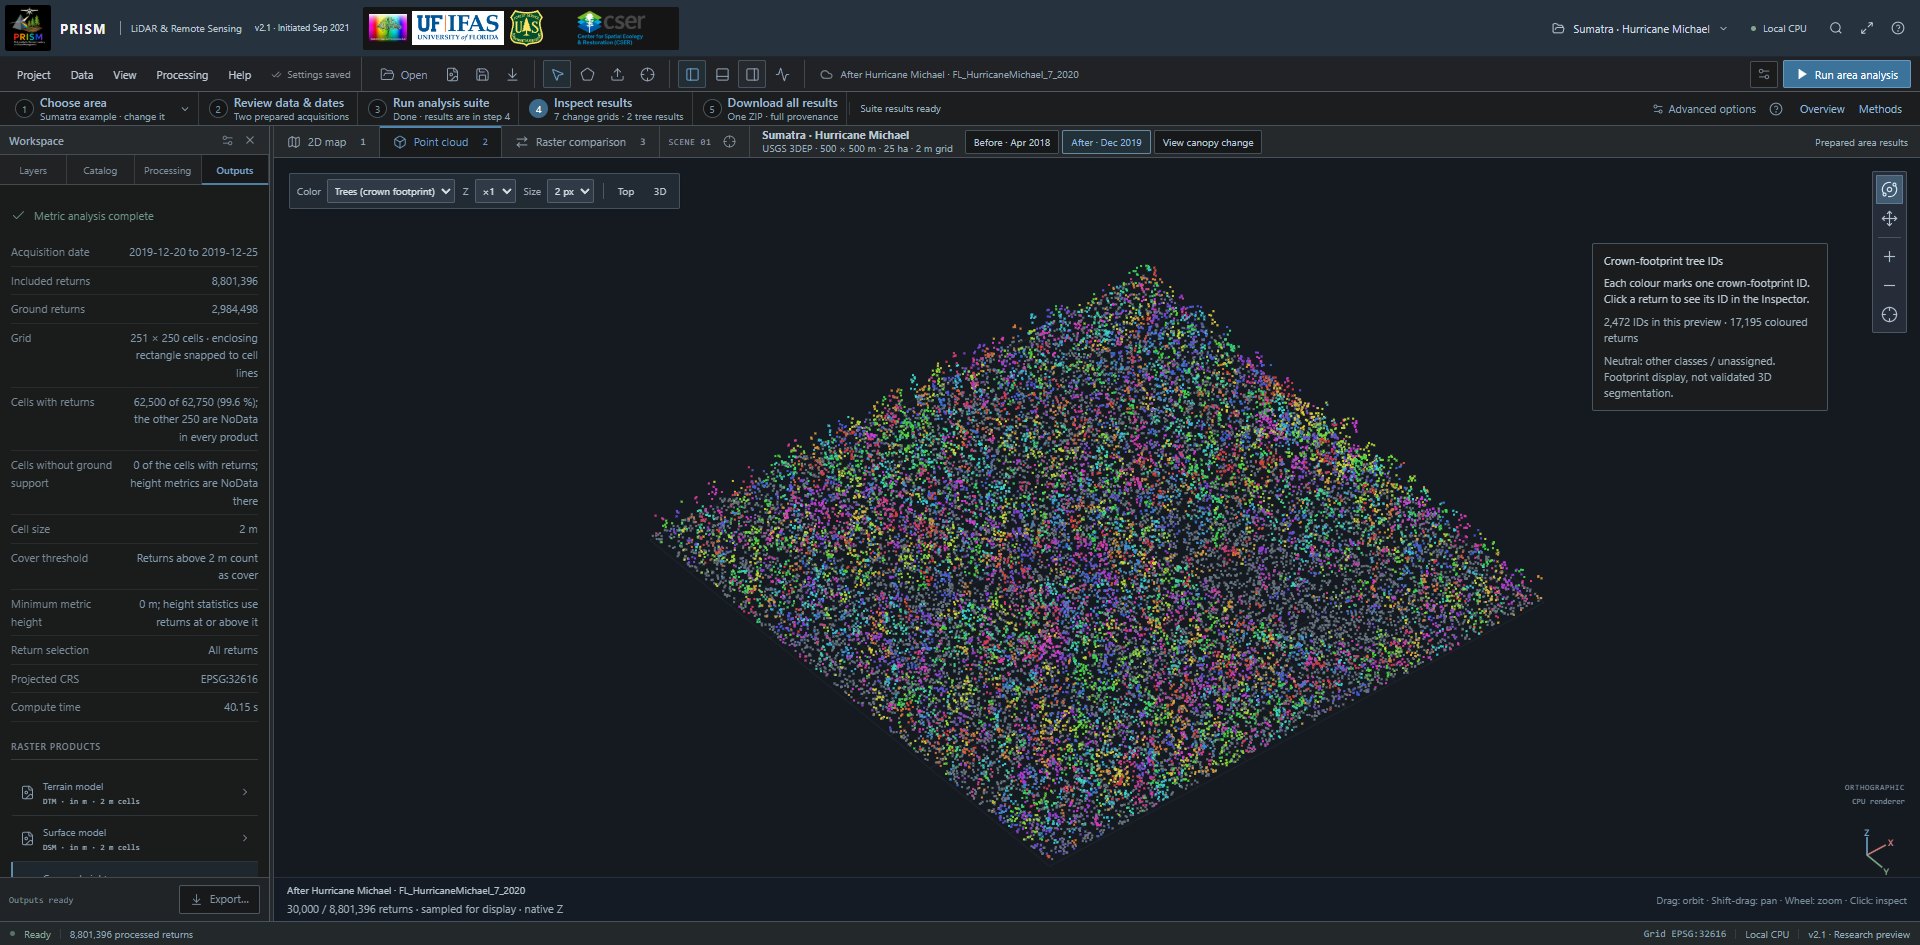
Real point returns coloured by the matching completed crown footprints; neutral classes and sampling limits remain visible. Open full-size screenshot (1920 × 945 px) Full-size image: https://prismlidar.app/manual-screenshots/tree-colours.jpg Captured 2026-11-11 on build a80a470a057e · PRISM 2.1. Use the in-app manual to highlight the live control.
Do this
In Point cloud, choose Trees (crown footprint) in the Color list. Matching source provenance enables it automatically. For an unlinked real CHM, review acquisition and CRS before confirming the association.
What it does
Maps eligible vegetation/unclassified preview returns to the CHM crown footprint. Ground, buildings, noise and unassigned returns stay neutral.
What to expect
The same colours as the crown preview. This is a display association, not validated 3D point segmentation or tree-ID LAS export.
Process multiple acquisitions
Retrieve two or three dated sources on one frozen analysis grid.
Before you start: Two or three real sources covering the same study area. Verify acquisition dates from source metadata; a collection window from the USGS record and a year inferred from a source name are only hints. Ordinary per-acquisition limits apply.
21. Build the date queue
The actual acquisition catalog after drawing a new polygon: the step 2 note, then each source with its USGS collection window, Use this source and Add to date queue. On the map, the study-area bar offers Draw new area and Clear area. Open full-size screenshot (1920 × 945 px) Full-size image: https://prismlidar.app/manual-screenshots/catalog.jpg Captured 2026-11-11 on build e7f0689a4426 · PRISM 2.3. Use the in-app manual to highlight the live control.
Do this
In Catalog select Add to date queue for each source, then open Data → Multiple-date workspace.
What it does
Retains selected source descriptors without downloading their point data yet.
What to expect
Two or three acquisition cards. Large tiled multi-date orchestration is not implemented.
22. Verify dates and references
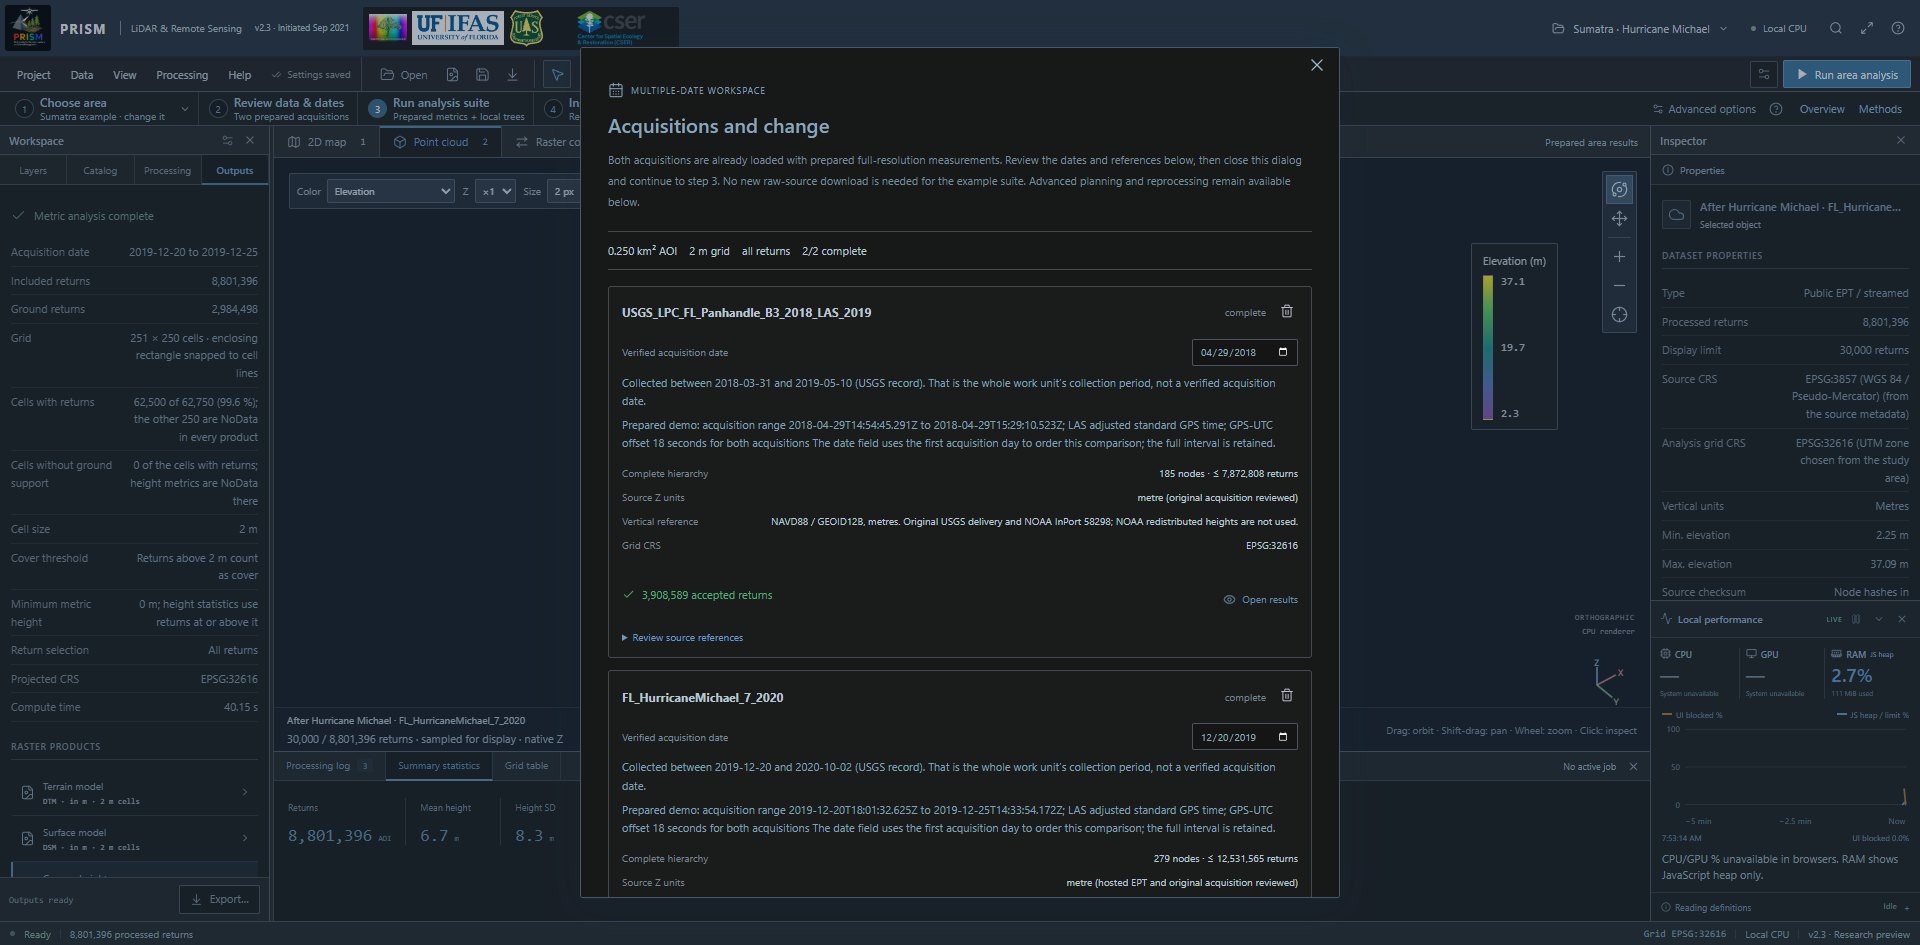
The prepared example’s two acquisitions (2/2 complete), with verified dates, the USGS collection window of each source under its date field, source Z units, vertical references and grid CRS. Open full-size screenshot (1920 × 945 px) Full-size image: https://prismlidar.app/manual-screenshots/dated-acquisitions.jpg Captured 2026-11-11 on build e7f0689a4426 · PRISM 2.3. Use the in-app manual to highlight the live control.
Do this
In Acquisitions and change, the prepared Sumatra example already contains both completed acquisitions. Review its full acquisition intervals, units and references, then close the dialog and continue to step 3. For new sources, enter verified acquisition dates, select Plan all acquisitions and review the source declarations before downloading.
What it does
Plans each acquisition against the same AOI, grid and metric settings.
What to expect
The example retains April 29, 2018 and December 20–25, 2019; its date fields use the first acquisition day for ordering. Computed-product inspectors retain the actual date or interval. Unit conversion does not reconcile different vertical datums or misaligned acquisitions. Under each date field, a catalog source that has a collection window shows it; that is the collection period of the whole USGS work unit, and PRISM never enters it as the date.
23. Process the dates
The prepared example’s two acquisitions (2/2 complete), with verified dates, the USGS collection window of each source under its date field, source Z units, vertical references and grid CRS. Open full-size screenshot (1920 × 945 px) Full-size image: https://prismlidar.app/manual-screenshots/dated-acquisitions.jpg Captured 2026-11-11 on build e7f0689a4426 · PRISM 2.3. Use the in-app manual to highlight the live control.
Do this
Select Download & process dates and keep the tab open. Export completed dates after processing.
What it does
Downloads and processes each date sequentially on this device.
What to expect
Per-date products and accepted-return counts. These completed results remain in the current session until exported.
24. Compare compatible results
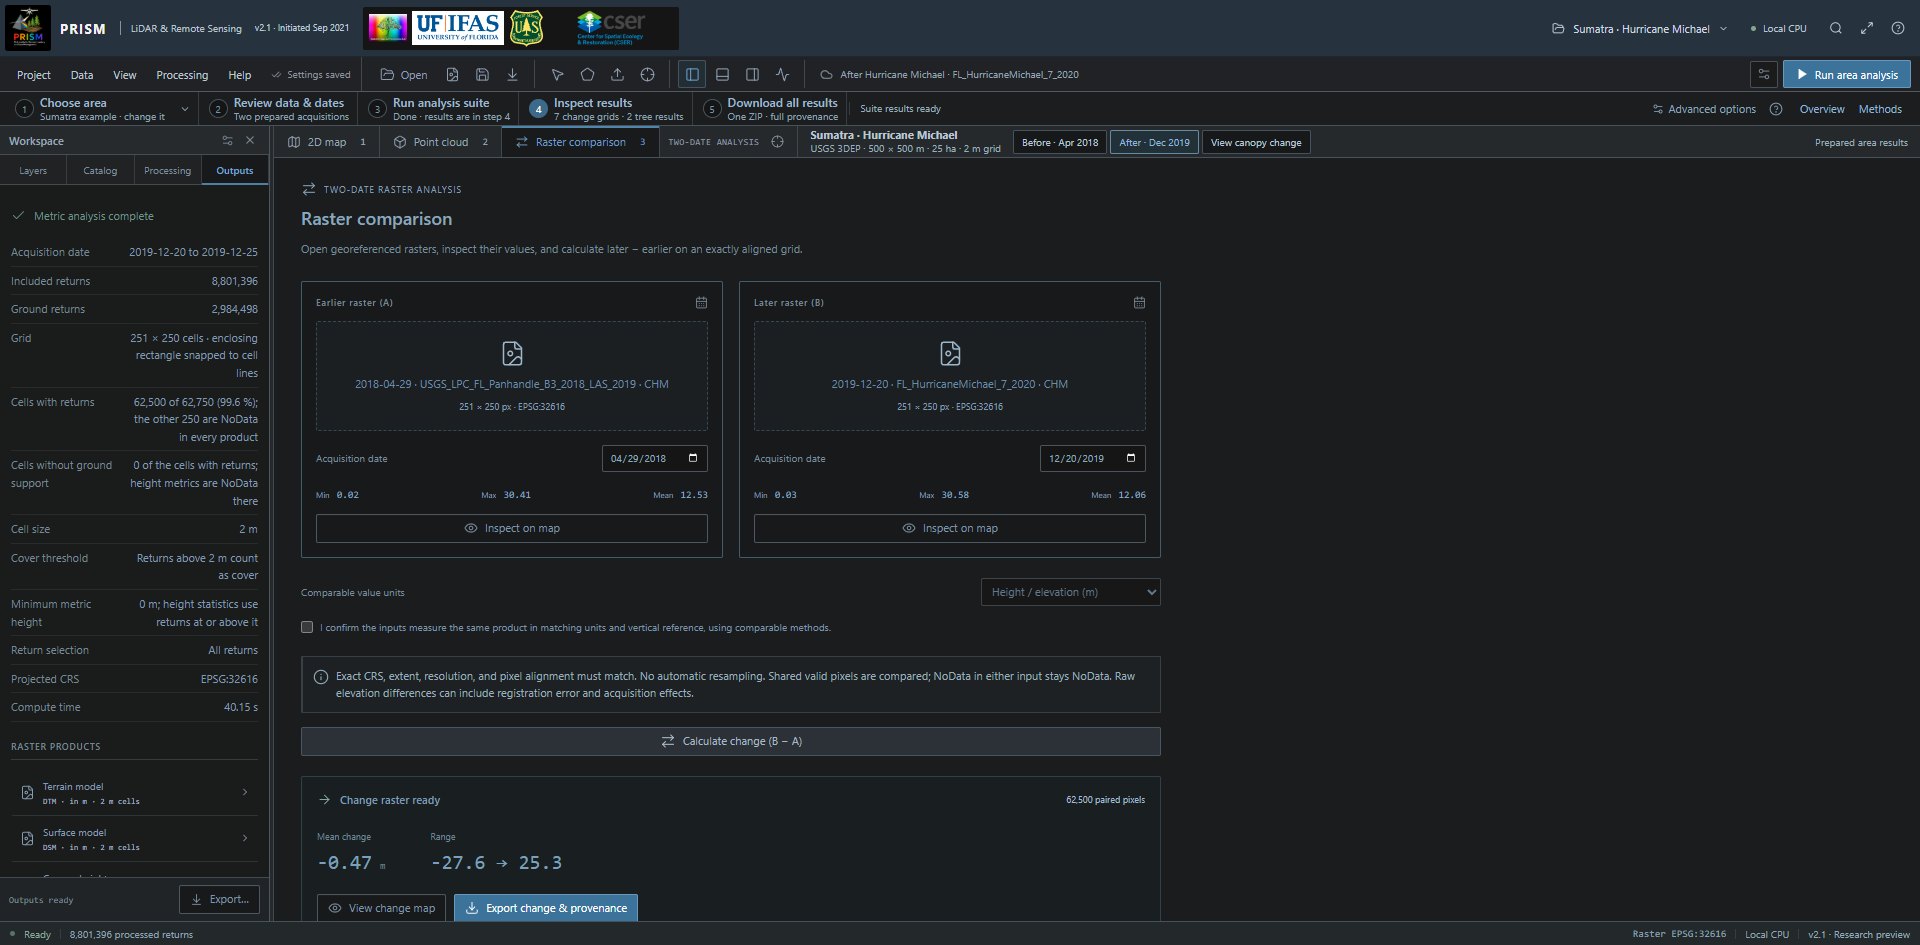
The real comparison panel populated by the prepared CHM pair; dates, units, comparability review and change export remain explicit. Open full-size screenshot (1920 × 945 px) Full-size image: https://prismlidar.app/manual-screenshots/raster-comparison.jpg Captured 2026-11-11 on build a80a470a057e · PRISM 2.1. Use the in-app manual to highlight the live control.
Do this
After at least two dates complete, use Compare completed dates, select earlier A/later B and the same product, review comparability, then calculate later − earlier.
What it does
Subtracts paired valid pixels on the exact grid. It does not register acquisitions or quantify uncertainty.
What to expect
The map gives later-minus-earlier dates, product units and lower/no-change/higher colour directions. Positive values mean a larger later value; negative values mean a smaller later value. Its visible method notice explains that storm damage, salvage and acquisition effects are not distinguished. NoData remains missing data, not zero.
Compare existing raster files
Calculate exact-grid differences from two compatible GeoTIFFs.
Before you start: Single-band numeric, north-up, pixel-is-area GeoTIFFs with matching CRS, extent, resolution and alignment. Per file: at most 40 MB and 4 million pixels.
25. Open the pair
The real comparison panel populated by the prepared CHM pair; dates, units, comparability review and change export remain explicit. Open full-size screenshot (1920 × 945 px) Full-size image: https://prismlidar.app/manual-screenshots/raster-comparison.jpg Captured 2026-11-11 on build a80a470a057e · PRISM 2.1. Use the in-app manual to highlight the live control.
Do this
Select Raster comparison and open Earlier and later rasters. Enter verified dates and choose comparable value units.
What it does
Inspects the files locally. It does not automatically resample, align or transform their vertical references.
What to expect
Separate raster statistics. Check that both measure the same physical product and use comparable acquisition/processing methods.
26. Calculate and save the difference
The real comparison panel populated by the prepared CHM pair; dates, units, comparability review and change export remain explicit. Open full-size screenshot (1920 × 945 px) Full-size image: https://prismlidar.app/manual-screenshots/raster-comparison.jpg Captured 2026-11-11 on build a80a470a057e · PRISM 2.1. Use the in-app manual to highlight the live control.
Do this
Review the comparability declaration and select Calculate change (B − A). Inspect the map and export change & provenance.
What it does
Computes B − A only for paired valid pixels; either input's NoData remains NoData.
What to expect
A change raster, not an uncertainty-adjusted estimate of growth, carbon, biomass or fire severity.
Save work and check this device
Understand what persists, inspect local performance and identify the software release.
Before you start: Keep the tab open until exports finish. A saved project manifest does not retain point files or result rasters.
27. Save settings and project context
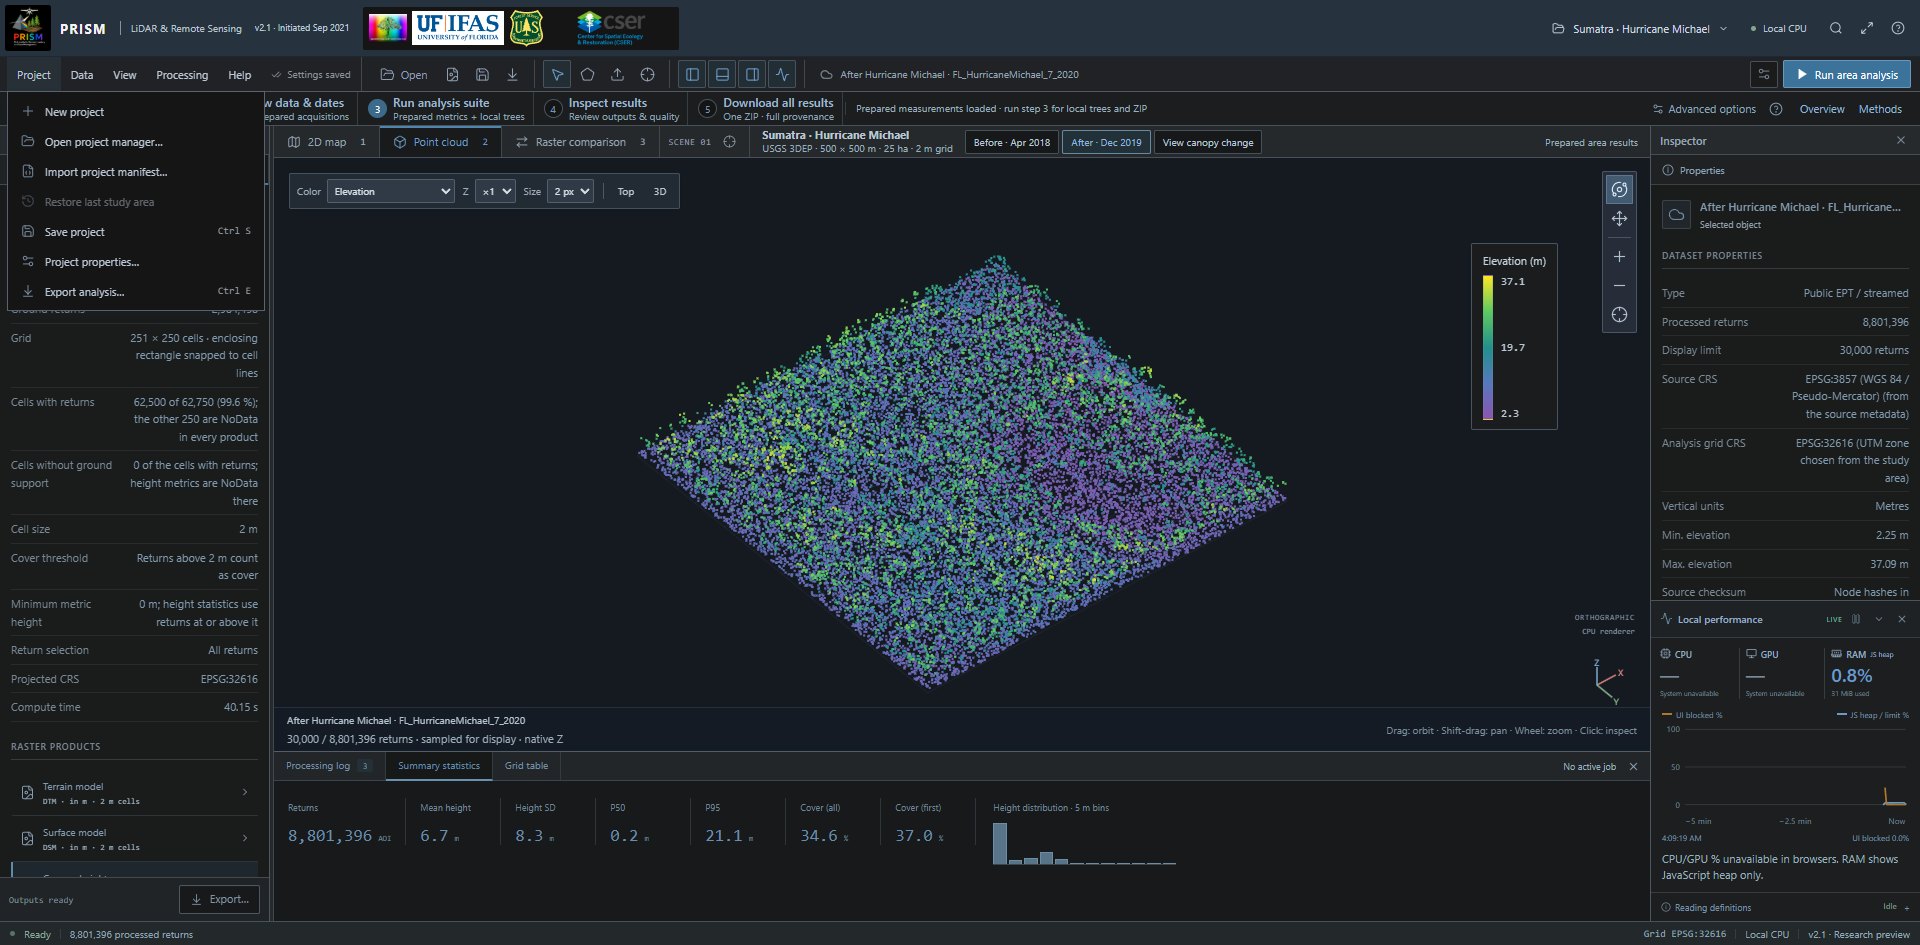
The Project menu: New project, Open project manager, Import project manifest, Restore last study area (unavailable here because no study area is saved in this browser), Save project (Ctrl S), Project properties and Export analysis (Ctrl E). Open full-size screenshot (1920 × 945 px) Full-size image: https://prismlidar.app/manual-screenshots/project-menu.jpg Captured 2026-11-11 on build a80a470a057e · PRISM 2.1. Use the in-app manual to highlight the live control.
Do this
Select Save project or Ctrl/Cmd S. Use Project → Export analysis for a portable manifest/bundle.
What it does
Browser storage retains AOI and settings on this origin. Raw inputs and session results must be reopened or exported separately.
What to expect
The “Settings saved” indicator and a saved project entry on this browser. Results must be exported before closing. Different domains, browsers and devices do not share local storage automatically.
28. Export the results you need
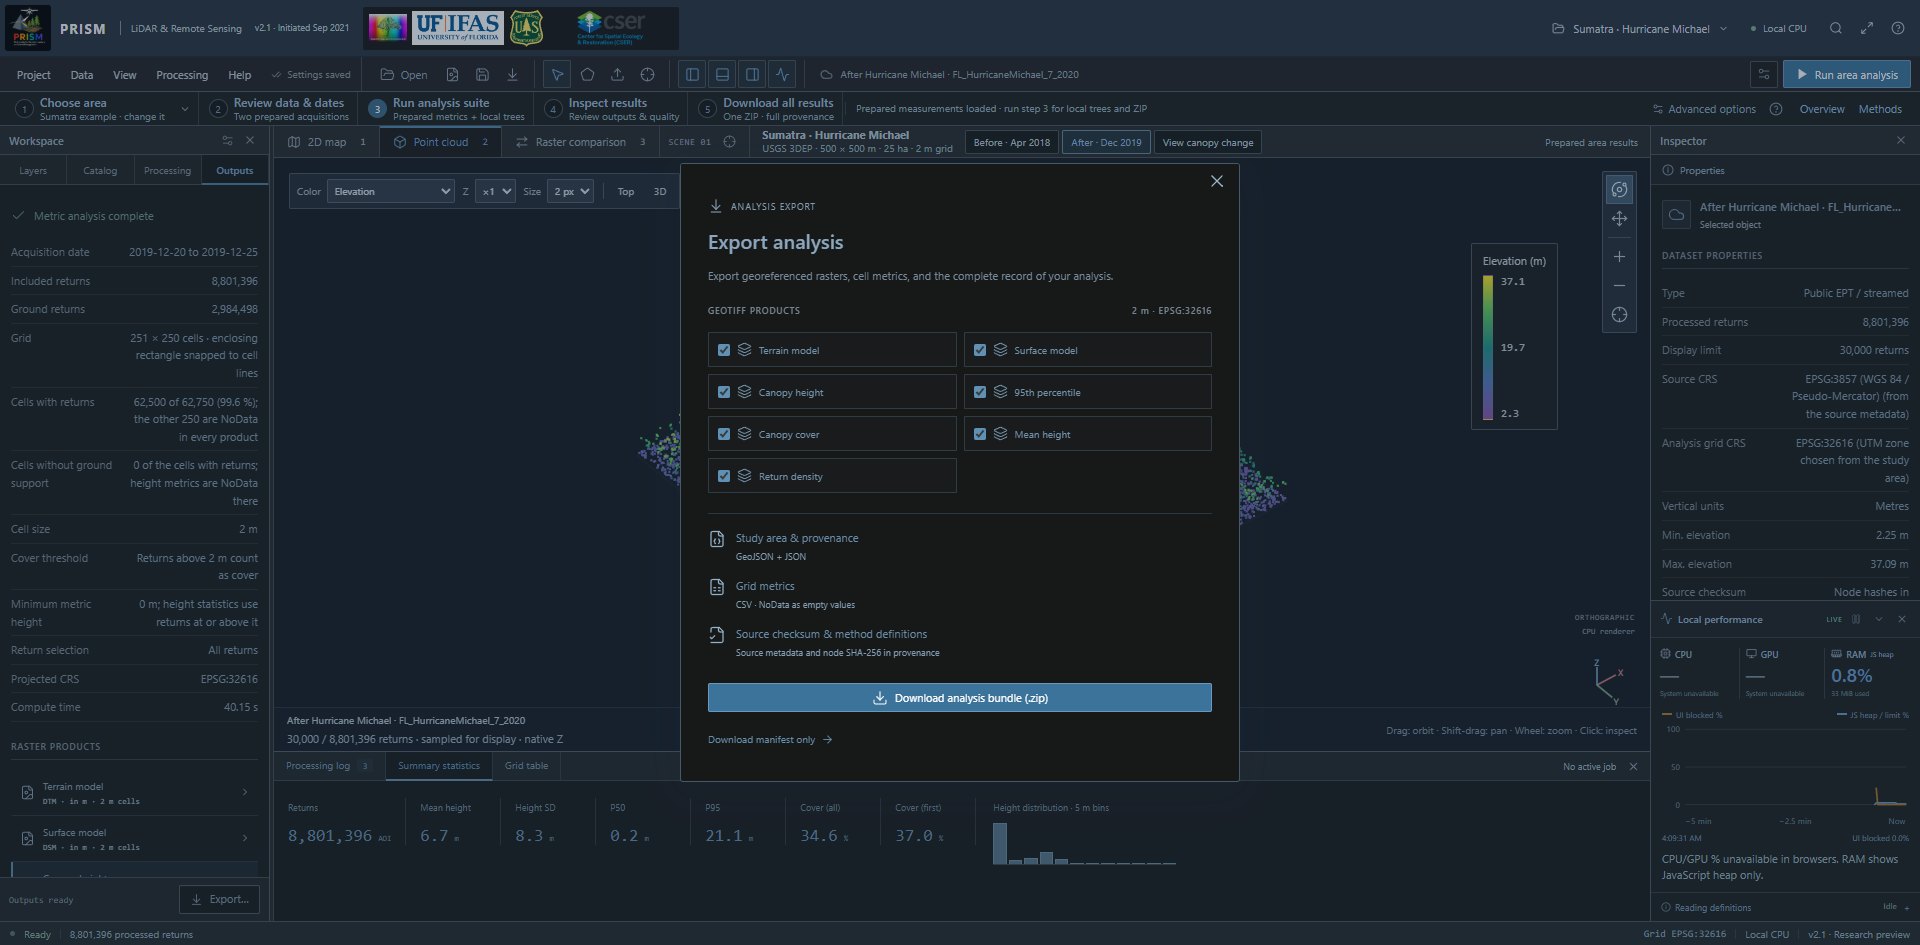
All seven area products selected for a georeferenced analysis ZIP, with grid metrics, the study area and provenance. Open full-size screenshot (1920 × 945 px) Full-size image: https://prismlidar.app/manual-screenshots/export.jpg Captured 2026-11-11 on build a80a470a057e · PRISM 2.1. Use the in-app manual to highlight the live control.
Do this
In Export analysis, choose available products and download the analysis bundle. Export trees, date queues and tiled folders through their own workflows.
What it does
Saves outputs with provenance rather than relying on an open browser session.
What to expect
GeoTIFFs, CSV, study-area GeoJSON and provenance JSON. Reopen selected outputs in a desktop GIS to review coordinates and NoData.
29. Run device readiness checks
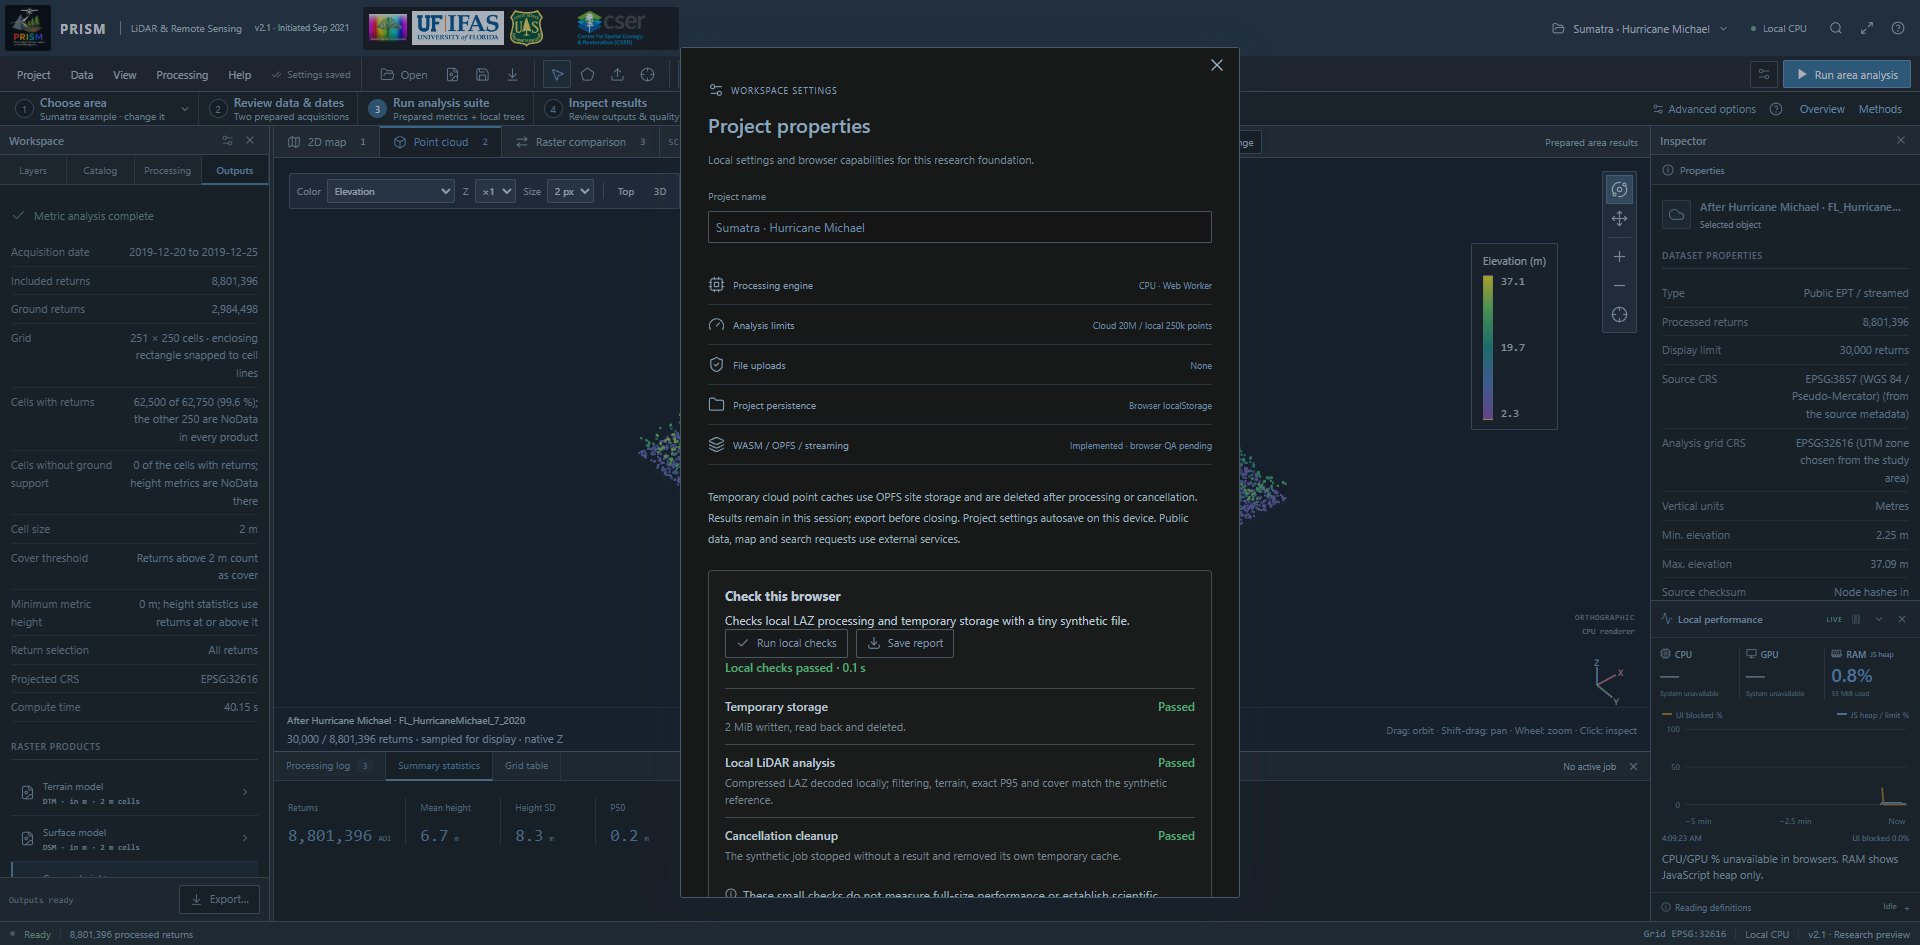
Actual local readiness checks passed for temporary storage, synthetic LAZ analysis and cancellation cleanup; this is not full-size scientific validation. Open full-size screenshot (1920 × 945 px) Full-size image: https://prismlidar.app/manual-screenshots/project-checks.jpg Captured 2026-11-11 on build a80a470a057e · PRISM 2.1. Use the in-app manual to highlight the live control.
Do this
Open Project → Project properties. Under Check this browser, select Run local checks and optionally Save report.
What it does
Exercises a tiny synthetic worker/decoder, temporary storage and cancellation on this browser.
What to expect
Passed, limited or failed checks with explanations. It is not a full-size performance benchmark or scientific validation.
30. Read local performance honestly
The live performance monitor labels system CPU/GPU usage as unavailable and separates JavaScript heap from UI blocking. Open full-size screenshot (1920 × 945 px) Full-size image: https://prismlidar.app/manual-screenshots/performance.jpg Captured 2026-11-11 on build a80a470a057e · PRISM 2.1. Use the in-app manual to highlight the live control.
Do this
Open View → Local performance monitor and inspect its moving five-minute time axis.
What it does
Samples supported JavaScript heap/limit and main-thread long-task blocking every two seconds.
What to expect
System CPU %, GPU % and total RAM % are marked unavailable because ordinary browser pages cannot read them. The current processing queue uses one worker.
31. Record the release and citation
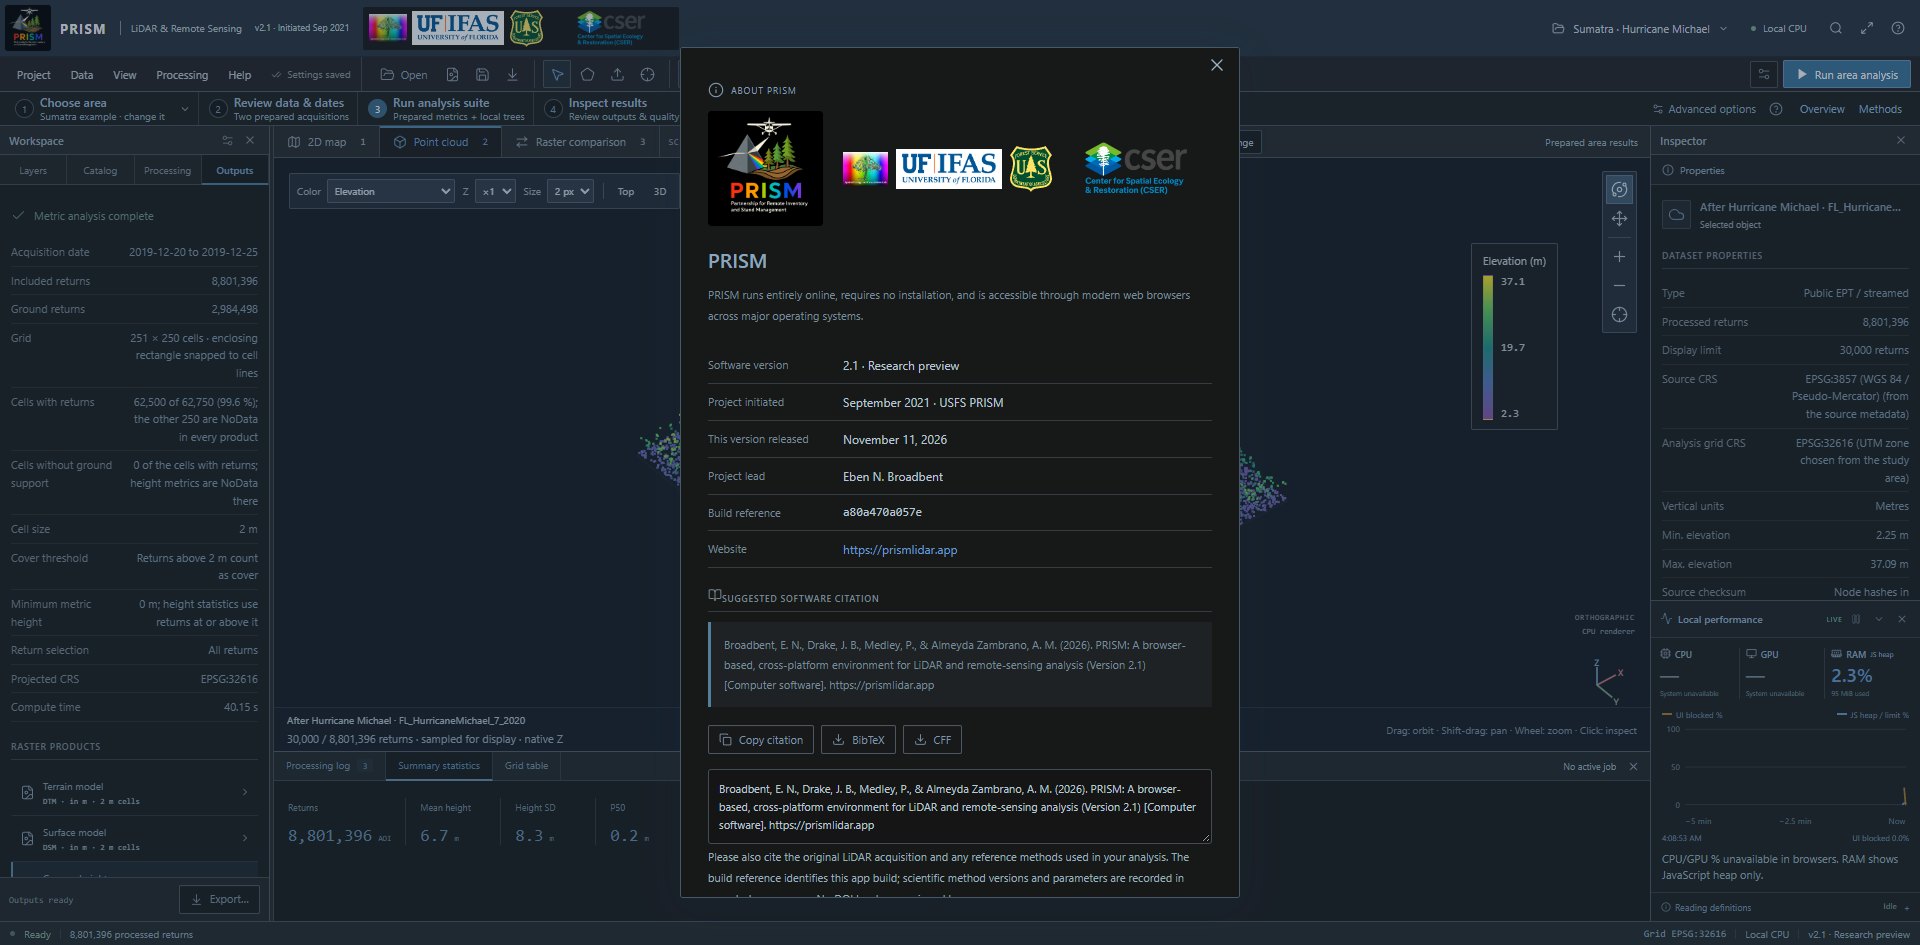
About PRISM lists the software version, project start, the release date of this version, build reference and suggested software citation. Open full-size screenshot (1920 × 945 px) Full-size image: https://prismlidar.app/manual-screenshots/about.jpg Captured 2026-11-11 on build a80a470a057e · PRISM 2.1. Use the in-app manual to highlight the live control.
Do this
Open Help → About PRISM; copy the software citation or download BibTeX/CFF.
What it does
Lists software version, release date, build reference and project lead Eben N. Broadbent. The build reference identifies the published build, so the one you see can differ from the one pictured.
What to expect
Cite the software version and the original data and methods used. About includes the AI-assistance acknowledgment and a link to the release-notes page with versions, dates and changes. A software citation does not imply method validation.
Fire and fuels: current scope
Separate available structural measurements from the planned fuels module.
Before you start: The dedicated fire/fuels module is planned. No operational fire-behaviour product is available in this release.
32. Understand the available inputs
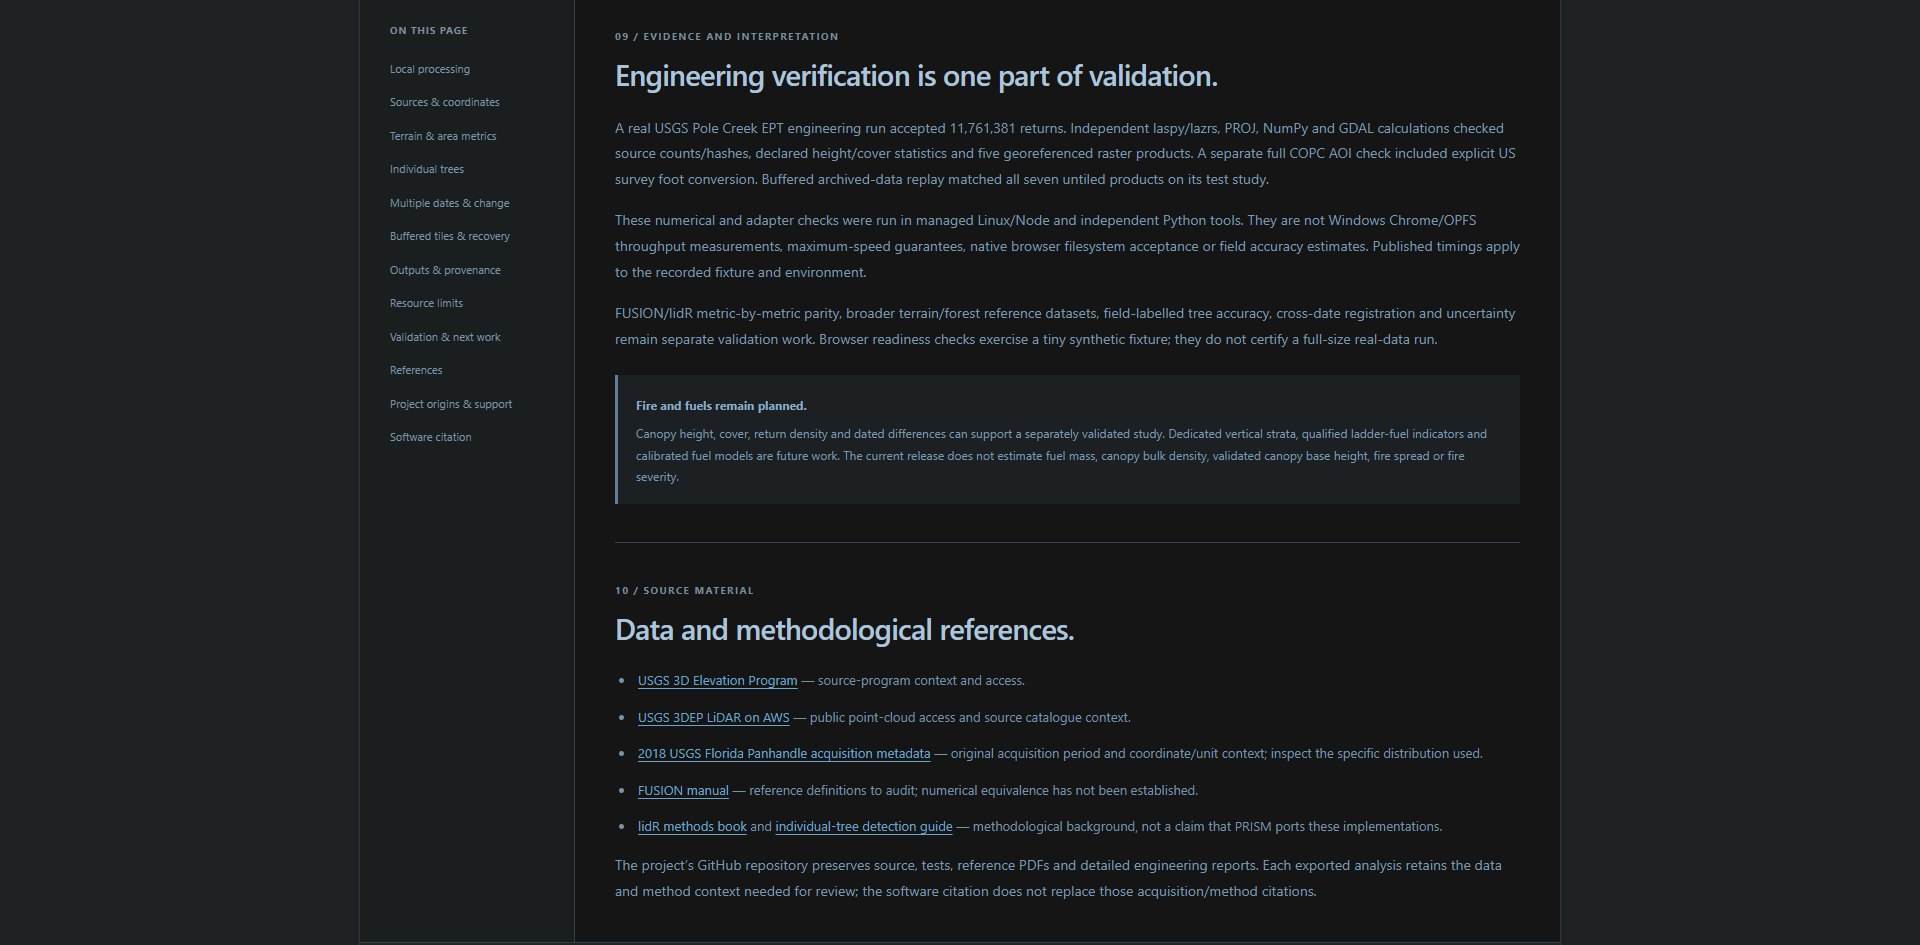
The Methods validation section distinguishes engineering checks from field/reference validation and identifies fire/fuels models as planned. Open full-size screenshot (1920 × 945 px) Full-size image: https://prismlidar.app/manual-screenshots/methods-limits.jpg Captured 2026-11-11 on build a80a470a057e · PRISM 2.1. Use the in-app manual to highlight the live control.
Do this
Open Help → Methods and validation and review the Fire & fuels row of the implementation registry; its status is Planned. Current canopy height, cover, density and dated differences can supply inputs to a separately validated fire/fuels study.
What it does
Reports geometric/return-based measurements. LiDAR return distributions are not direct measurements of fuel mass or surface-fuel loading.
What to expect
No current fuel-load, canopy-bulk-density, validated canopy-base-height, fire-spread or fire-severity calculation. Planned work includes vertical strata and qualified ladder-fuel indicators, with reference/field validation before fuel models.